\n
## Line Chart: Accuracy vs. C Parameter
### Overview
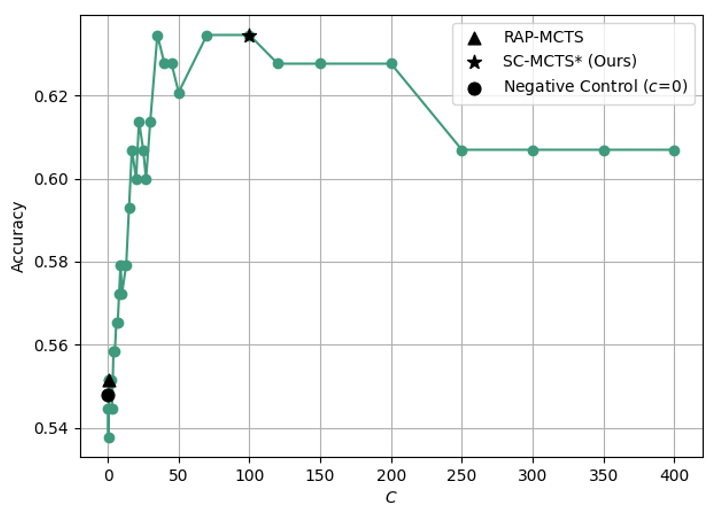
The image presents a line chart comparing the accuracy of three different methods – RAP-MCTS, SC-MCTS* (labeled as "Ours"), and a Negative Control (c=0) – as a function of the 'C' parameter. The chart visually demonstrates how accuracy changes with varying values of 'C'.
### Components/Axes
* **X-axis:** Labeled "C", ranging from approximately 0 to 400, with markers at 0, 50, 100, 150, 200, 250, 300, 350, and 400.
* **Y-axis:** Labeled "Accuracy", ranging from approximately 0.54 to 0.63, with markers at 0.54, 0.56, 0.58, 0.60, 0.62.
* **Legend:** Located in the top-right corner.
* RAP-MCTS: Represented by black triangles (▲).
* SC-MCTS* (Ours): Represented by black stars (★).
* Negative Control (c=0): Represented by black circles (●).
* **Gridlines:** Present to aid in reading values.
### Detailed Analysis
* **Negative Control (c=0):** The line starts at approximately 0.54 at C=0, increases sharply to around 0.58 at C=10, then plateaus around 0.58 until C=150. After C=150, the accuracy decreases steadily, reaching approximately 0.55 at C=400.
* **SC-MCTS* (Ours):** The line begins at approximately 0.61 at C=0, increases to a peak of around 0.63 at C=75, then fluctuates between approximately 0.62 and 0.63 until C=200. After C=200, the accuracy decreases to approximately 0.61 at C=400.
* **RAP-MCTS:** The line starts at approximately 0.55 at C=0, increases rapidly to a peak of around 0.63 at C=50, then decreases slightly to approximately 0.62 at C=100. It remains relatively stable around 0.62-0.63 until C=250, after which it declines to approximately 0.61 at C=400.
Here's a more detailed breakdown of approximate data points:
| C | Negative Control | SC-MCTS* (Ours) | RAP-MCTS |
| :---- | :--------------- | :-------------- | :------- |
| 0 | 0.54 | 0.61 | 0.55 |
| 10 | 0.58 | 0.62 | 0.62 |
| 50 | 0.58 | 0.63 | 0.63 |
| 75 | 0.58 | 0.63 | 0.62 |
| 100 | 0.58 | 0.62 | 0.62 |
| 150 | 0.58 | 0.62 | 0.62 |
| 200 | 0.57 | 0.62 | 0.62 |
| 250 | 0.56 | 0.62 | 0.62 |
| 300 | 0.55 | 0.61 | 0.61 |
| 350 | 0.55 | 0.61 | 0.61 |
| 400 | 0.55 | 0.61 | 0.61 |
### Key Observations
* SC-MCTS* (Ours) and RAP-MCTS achieve higher accuracy than the Negative Control across all values of 'C'.
* Both SC-MCTS* and RAP-MCTS exhibit an initial increase in accuracy with increasing 'C', followed by a plateau and eventual decline.
* The Negative Control shows a relatively stable accuracy until C=150, after which it decreases.
* The peak accuracy for SC-MCTS* and RAP-MCTS is around C=75 and C=50 respectively.
### Interpretation
The chart suggests that the 'C' parameter has a significant impact on the accuracy of the tested methods. Initially, increasing 'C' improves accuracy, likely due to increased exploration or exploitation in the search process. However, beyond a certain point, increasing 'C' leads to diminishing returns and eventually a decrease in accuracy, potentially due to overfitting or increased computational cost.
The consistently higher accuracy of SC-MCTS* (Ours) and RAP-MCTS compared to the Negative Control indicates that these methods are more effective at solving the underlying problem. The slight difference in peak accuracy and the rate of decline between SC-MCTS* and RAP-MCTS suggest that they have different strengths and weaknesses, and the optimal value of 'C' may vary depending on the specific method used. The negative control serves as a baseline, demonstrating the performance without the specific enhancements implemented in the other two methods. The decline in the negative control after C=150 could indicate a point where the baseline method begins to suffer from the increased complexity or noise introduced by higher 'C' values.