## Line Chart: Accuracy vs. Parameter C for Different MCTS Methods
### Overview
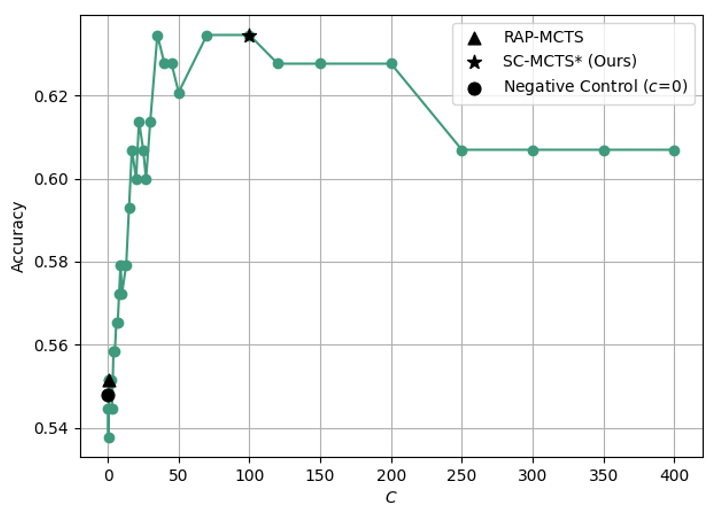
The image is a line chart plotting "Accuracy" on the y-axis against a parameter "C" on the x-axis. It compares the performance of three different methods or conditions: RAP-MCTS, SC-MCTS* (Ours), and a Negative Control (c=0). The chart demonstrates how accuracy changes as the value of C increases from 0 to 400.
### Components/Axes
* **X-Axis:** Labeled "C". The scale is linear, with major tick marks at 0, 50, 100, 150, 200, 250, 300, 350, and 400.
* **Y-Axis:** Labeled "Accuracy". The scale is linear, with major tick marks at 0.54, 0.56, 0.58, 0.60, and 0.62.
* **Legend:** Located in the top-right corner of the plot area. It defines three data series:
1. **RAP-MCTS:** Represented by a black upward-pointing triangle (▲).
2. **SC-MCTS* (Ours):** Represented by a black five-pointed star (★).
3. **Negative Control (c=0):** Represented by a black circle (●).
* **Data Series:** The primary data is plotted as a single, connected green line with circular markers at each data point. The legend symbols (triangle, star, circle) are overlaid on this green line at specific points corresponding to their respective methods.
### Detailed Analysis
**1. Data Series Mapping & Spatial Grounding:**
The green line with circular markers represents the performance of the **SC-MCTS* (Ours)** method across varying C values. The other two legend entries (RAP-MCTS and Negative Control) are not separate lines but specific, single-point annotations on this main green line.
**2. SC-MCTS* (Ours) - Green Line with Circular Markers:**
* **Trend Verification:** The line shows a sharp, non-linear increase in accuracy from C=0 to a peak, followed by a plateau and a slight decline to a stable level.
* **Data Points (Approximate):**
* C=0: Accuracy ≈ 0.538 (lowest point).
* C ≈ 5: Accuracy ≈ 0.545.
* C ≈ 10: Accuracy ≈ 0.555.
* C ≈ 15: Accuracy ≈ 0.565.
* C ≈ 20: Accuracy ≈ 0.572.
* C ≈ 25: Accuracy ≈ 0.579.
* C ≈ 30: Accuracy ≈ 0.593.
* C ≈ 35: Accuracy ≈ 0.607.
* C ≈ 40: Accuracy ≈ 0.600.
* C ≈ 45: Accuracy ≈ 0.614.
* C ≈ 50: Accuracy ≈ 0.620.
* C ≈ 55: Accuracy ≈ 0.628.
* C ≈ 60: Accuracy ≈ 0.621.
* C ≈ 70: Accuracy ≈ 0.635.
* **C = 100: Accuracy ≈ 0.635 (Peak, marked with ★).**
* C ≈ 120: Accuracy ≈ 0.628.
* C ≈ 150: Accuracy ≈ 0.628.
* C ≈ 200: Accuracy ≈ 0.628.
* C ≈ 250: Accuracy ≈ 0.607.
* C ≈ 300: Accuracy ≈ 0.607.
* C ≈ 350: Accuracy ≈ 0.607.
* C ≈ 400: Accuracy ≈ 0.607.
**3. RAP-MCTS (▲):**
* **Placement:** A single black triangle is overlaid on the green line at **C=0**.
* **Value:** Accuracy ≈ 0.551.
**4. Negative Control (c=0) (●):**
* **Placement:** A single black circle is overlaid on the green line at **C=0**, positioned slightly below the RAP-MCTS triangle.
* **Value:** Accuracy ≈ 0.548.
### Key Observations
1. **Dominant Trend:** The SC-MCTS* method shows a strong positive correlation between C and accuracy for low C values (0-100), achieving its peak performance at C=100.
2. **Performance Plateau & Decline:** After the peak at C=100, accuracy slightly decreases and then stabilizes at a lower plateau (≈0.607) from C=250 onwards.
3. **Baseline Comparison at C=0:** At the starting point (C=0), all methods have low accuracy. The Negative Control (c=0) performs worst (≈0.548), RAP-MCTS is slightly better (≈0.551), and the initial point for SC-MCTS* is the lowest (≈0.538).
4. **Significant Improvement:** The SC-MCTS* method demonstrates a substantial improvement over its own starting point and the other baselines, with its peak accuracy (≈0.635) being notably higher than the values at C=0.
### Interpretation
The data suggests that the parameter **C is a critical hyperparameter for the SC-MCTS* method**, with an optimal value around **C=100** for maximizing accuracy on this task. The method's performance is highly sensitive to C in the lower range, showing rapid gains. The plateau after C=200 indicates diminishing returns or a performance ceiling for higher C values.
The inclusion of the **Negative Control (c=0)** serves as a baseline, confirming that the observed improvements are not due to random chance but are linked to the method and the tuning of C. The **RAP-MCTS** point at C=0 provides a comparison to another method at the default parameter setting, which SC-MCTS* surpasses significantly at its optimal point.
The chart effectively argues for the efficacy of the SC-MCTS* method and identifies its optimal operational range. The slight decline after the peak could indicate potential overfitting or a change in the search dynamics at very high C values, warranting further investigation.