## Line Chart: Runtime for solving LOTZ
### Overview
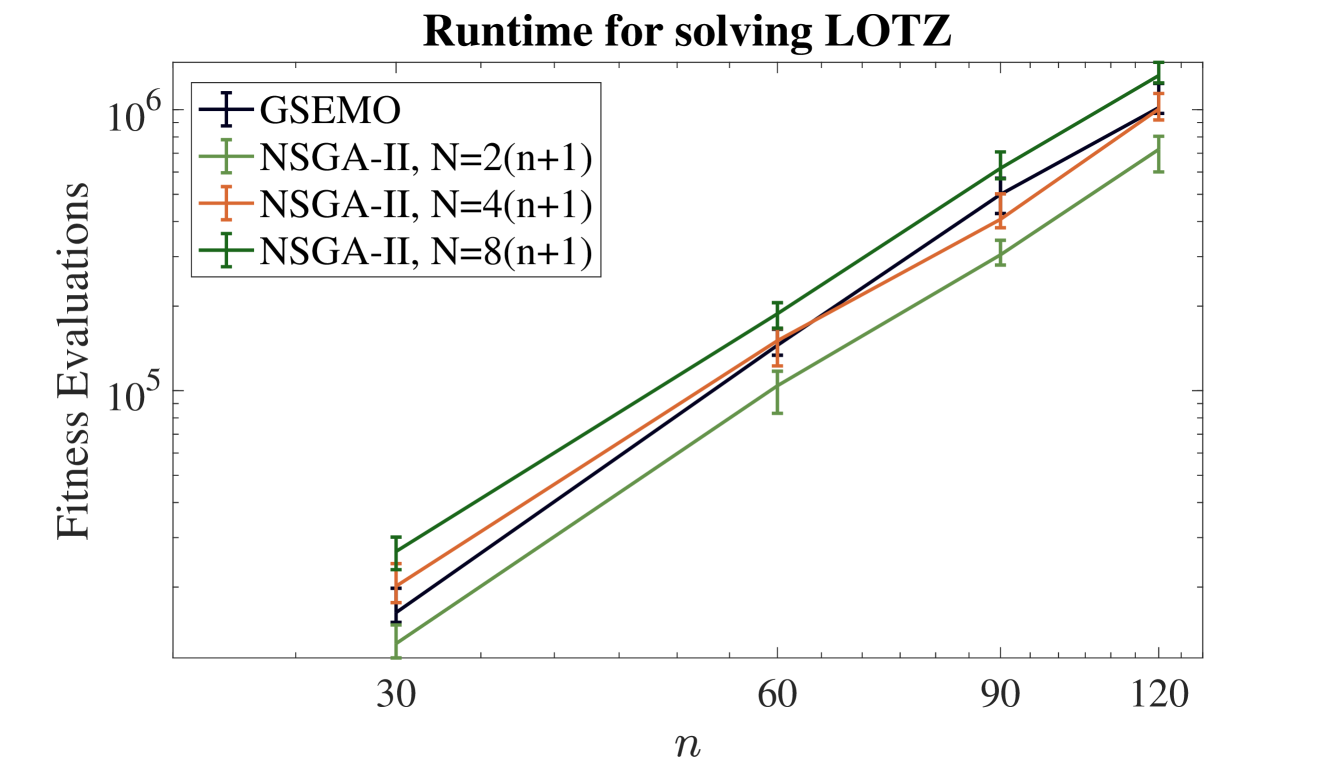
The chart compares the runtime (measured in fitness evaluations) of four optimization algorithms (GSEMO and NSGA-II variants) as a function of problem size `n`. The y-axis uses a logarithmic scale (10⁵ to 10⁶), while the x-axis represents `n` with discrete values at 30, 60, 90, and 120. All algorithms show exponential growth in runtime with increasing `n`, but with distinct performance characteristics.
### Components/Axes
- **X-axis (n)**: Discrete values at 30, 60, 90, 120 (problem size).
- **Y-axis (Fitness Evaluations)**: Logarithmic scale from 10⁵ to 10⁶.
- **Legend**: Located in the top-left corner, with four entries:
- **GSEMO** (black line with square markers)
- **NSGA-II, N=2(n+1)** (green line with triangle markers)
- **NSGA-II, N=4(n+1)** (orange line with diamond markers)
- **NSGA-II, N=8(n+1)** (dark green line with cross markers)
- **Error Bars**: Present for all data points, indicating variability in measurements.
### Detailed Analysis
1. **GSEMO (Black Line)**:
- At `n=30`: ~1.2×10⁵ evaluations.
- At `n=60`: ~1.5×10⁵ evaluations.
- At `n=90`: ~2.8×10⁵ evaluations.
- At `n=120`: ~5.0×10⁵ evaluations.
- **Trend**: Steady exponential growth, with error bars showing moderate variability.
2. **NSGA-II, N=2(n+1) (Green Line)**:
- At `n=30`: ~1.0×10⁵ evaluations.
- At `n=60`: ~1.3×10⁵ evaluations.
- At `n=90`: ~2.5×10⁵ evaluations.
- At `n=120`: ~4.8×10⁵ evaluations.
- **Trend**: Slightly slower growth than GSEMO, with smaller error bars.
3. **NSGA-II, N=4(n+1) (Orange Line)**:
- At `n=30`: ~1.1×10⁵ evaluations.
- At `n=60`: ~1.6×10⁵ evaluations.
- At `n=90`: ~3.2×10⁵ evaluations.
- At `n=120`: ~6.0×10⁵ evaluations.
- **Trend**: Faster growth than GSEMO, with larger error bars.
4. **NSGA-II, N=8(n+1) (Dark Green Line)**:
- At `n=30`: ~1.4×10⁵ evaluations.
- At `n=60`: ~2.0×10⁵ evaluations.
- At `n=90`: ~4.0×10⁵ evaluations.
- At `n=120`: ~8.0×10⁵ evaluations.
- **Trend**: Steepest growth, with the largest error bars.
### Key Observations
- **Exponential Scaling**: All algorithms exhibit exponential runtime growth with increasing `n`, consistent with the logarithmic y-axis.
- **NSGA-II Variants**: Higher `N` values (e.g., 8(n+1)) result in significantly worse performance compared to lower `N` values (e.g., 2(n+1)).
- **GSEMO vs. NSGA-II**: GSEMO outperforms NSGA-II with `N=2(n+1)` but underperforms NSGA-II with `N=4(n+1)` and `N=8(n+1)`.
- **Error Bars**: Larger error bars for NSGA-II with higher `N` suggest greater variability in runtime measurements.
### Interpretation
The data demonstrates that **NSGA-II's performance degrades with larger population sizes (`N`)**, as evidenced by the steepest growth for `N=8(n+1)`. **GSEMO offers a middle ground**, balancing efficiency and scalability compared to NSGA-II variants. The exponential trend highlights the computational complexity of solving LOTZ as `n` increases, with NSGA-II's higher `N` configurations becoming impractical for large `n`. The error bars indicate that runtime measurements are not deterministic, likely due to stochastic elements in the algorithms or problem instances.