## Chart: Runtime for solving LOTZ
### Overview
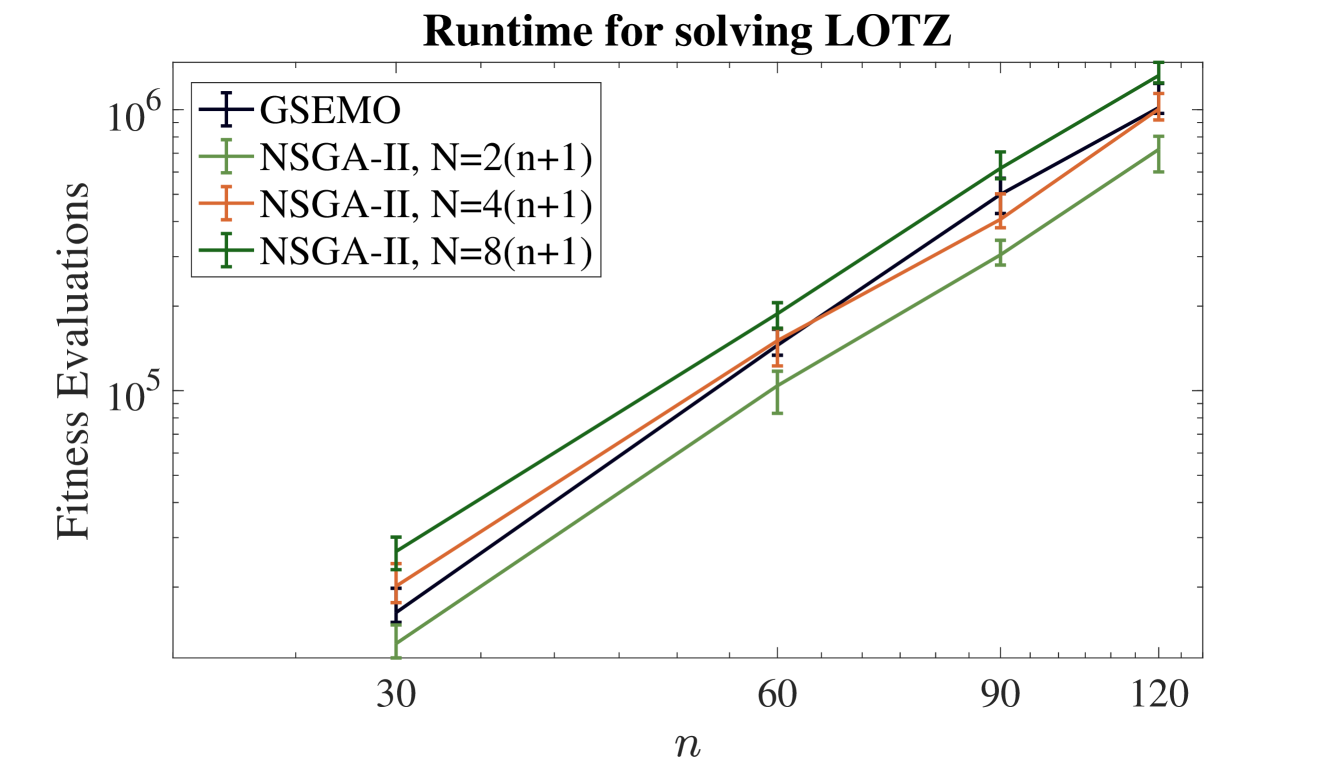
The image is a line chart comparing the performance of different algorithms (GSEMO and NSGA-II with varying parameters) in solving the LOTZ problem. The chart plots the number of fitness evaluations (y-axis, logarithmic scale) against the problem size 'n' (x-axis, linear scale). Error bars are present on each data point.
### Components/Axes
* **Title:** Runtime for solving LOTZ
* **X-axis:**
* Label: *n*
* Scale: Linear
* Ticks: 30, 60, 90, 120
* **Y-axis:**
* Label: Fitness Evaluations
* Scale: Logarithmic (base 10)
* Ticks: 10<sup>5</sup>, 10<sup>6</sup>
* **Legend:** Located in the top-left corner.
* Black: GSEMO
* Light Green: NSGA-II, N=2(n+1)
* Orange: NSGA-II, N=4(n+1)
* Dark Green: NSGA-II, N=8(n+1)
### Detailed Analysis
* **GSEMO (Black):** The line slopes upward.
* n=30: Fitness Evaluations ≈ 2.5 x 10<sup>4</sup>
* n=60: Fitness Evaluations ≈ 1.4 x 10<sup>5</sup>
* n=90: Fitness Evaluations ≈ 5.0 x 10<sup>5</sup>
* n=120: Fitness Evaluations ≈ 1.1 x 10<sup>6</sup>
* **NSGA-II, N=2(n+1) (Light Green):** The line slopes upward.
* n=30: Fitness Evaluations ≈ 1.8 x 10<sup>4</sup>
* n=60: Fitness Evaluations ≈ 9.0 x 10<sup>4</sup>
* n=90: Fitness Evaluations ≈ 3.0 x 10<sup>5</sup>
* n=120: Fitness Evaluations ≈ 6.0 x 10<sup>5</sup>
* **NSGA-II, N=4(n+1) (Orange):** The line slopes upward.
* n=30: Fitness Evaluations ≈ 2.2 x 10<sup>4</sup>
* n=60: Fitness Evaluations ≈ 1.2 x 10<sup>5</sup>
* n=90: Fitness Evaluations ≈ 4.0 x 10<sup>5</sup>
* n=120: Fitness Evaluations ≈ 9.0 x 10<sup>5</sup>
* **NSGA-II, N=8(n+1) (Dark Green):** The line slopes upward.
* n=30: Fitness Evaluations ≈ 2.8 x 10<sup>4</sup>
* n=60: Fitness Evaluations ≈ 1.5 x 10<sup>5</sup>
* n=90: Fitness Evaluations ≈ 5.5 x 10<sup>5</sup>
* n=120: Fitness Evaluations ≈ 1.3 x 10<sup>6</sup>
### Key Observations
* All algorithms show an increase in fitness evaluations as 'n' increases.
* The NSGA-II algorithm with N=2(n+1) consistently requires the fewest fitness evaluations.
* The NSGA-II algorithm with N=8(n+1) and GSEMO require the most fitness evaluations, with NSGA-II N=8(n+1) being slightly higher.
* The error bars indicate some variability in the performance of each algorithm.
### Interpretation
The chart demonstrates the runtime performance of different algorithms for solving the LOTZ problem, measured by the number of fitness evaluations required. The results suggest that NSGA-II with N=2(n+1) is the most efficient among the tested configurations, requiring the fewest fitness evaluations as the problem size increases. GSEMO and NSGA-II with N=8(n+1) are the least efficient. The logarithmic scale on the y-axis indicates that the number of fitness evaluations increases exponentially with 'n'. The error bars suggest that the performance of each algorithm can vary, but the overall trends remain consistent.