## Line Chart: Runtime for solving LOTZ
### Overview
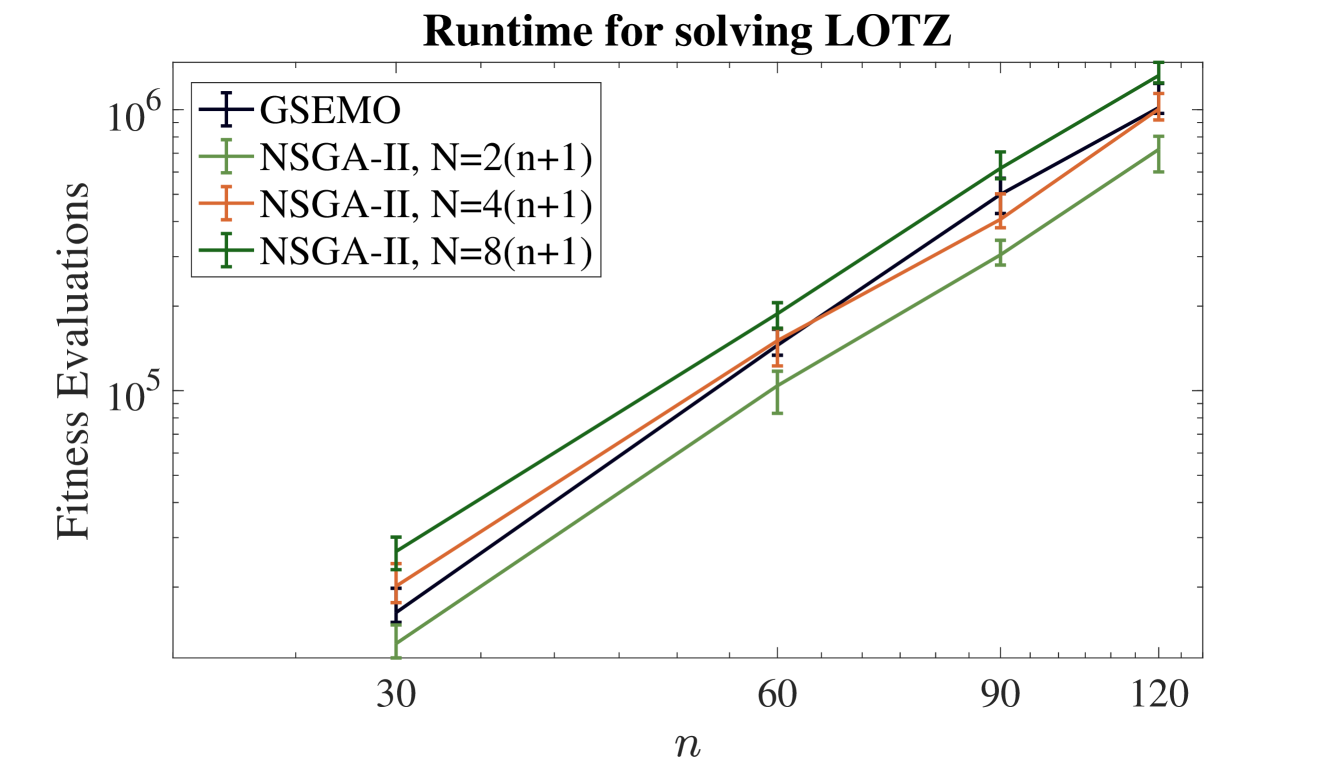
The image is a line chart comparing the computational runtime (measured in fitness evaluations) of four different algorithms or algorithm configurations for solving the "LOTZ" problem as the problem size parameter `n` increases. The chart uses a logarithmic scale for the y-axis.
### Components/Axes
* **Title:** "Runtime for solving LOTZ" (centered at the top).
* **Y-axis:** Label is "Fitness Evaluations". The scale is logarithmic, with major tick marks at `10^5` and `10^6`. Minor tick marks are present between these values.
* **X-axis:** Label is "n". The scale is linear with major tick marks at the values `30`, `60`, `90`, and `120`.
* **Legend:** Located in the top-left corner of the plot area. It contains four entries:
1. **GSEMO:** Represented by a dark blue line with plus-sign (`+`) markers.
2. **NSGA-II, N=2(n+1):** Represented by a light green line with plus-sign (`+`) markers.
3. **NSGA-II, N=4(n+1):** Represented by an orange line with plus-sign (`+`) markers.
4. **NSGA-II, N=8(n+1):** Represented by a dark green line with plus-sign (`+`) markers.
* **Data Series:** Four lines, each with data points at `n = 30, 60, 90, 120`. Each data point includes vertical error bars.
### Detailed Analysis
All four data series show a clear, consistent upward trend on the log-linear plot, indicating that the number of fitness evaluations increases exponentially with the problem size `n`.
**Approximate Data Points (Fitness Evaluations):**
* **At n = 30:**
* GSEMO (Dark Blue): ~2.5 x 10^4
* NSGA-II, N=2(n+1) (Light Green): ~1.8 x 10^4 (lowest)
* NSGA-II, N=4(n+1) (Orange): ~2.2 x 10^4
* NSGA-II, N=8(n+1) (Dark Green): ~3.0 x 10^4 (highest)
* **At n = 60:**
* GSEMO (Dark Blue): ~1.5 x 10^5
* NSGA-II, N=2(n+1) (Light Green): ~1.0 x 10^5 (lowest)
* NSGA-II, N=4(n+1) (Orange): ~1.3 x 10^5
* NSGA-II, N=8(n+1) (Dark Green): ~1.8 x 10^5 (highest)
* **At n = 90:**
* GSEMO (Dark Blue): ~5.0 x 10^5
* NSGA-II, N=2(n+1) (Light Green): ~3.0 x 10^5 (lowest)
* NSGA-II, N=4(n+1) (Orange): ~4.0 x 10^5
* NSGA-II, N=8(n+1) (Dark Green): ~6.0 x 10^5 (highest)
* **At n = 120:**
* GSEMO (Dark Blue): ~1.0 x 10^6
* NSGA-II, N=2(n+1) (Light Green): ~7.0 x 10^5 (lowest)
* NSGA-II, N=4(n+1) (Orange): ~1.0 x 10^6
* NSGA-II, N=8(n+1) (Dark Green): ~1.2 x 10^6 (highest)
**Error Bars:** All data points have vertical error bars indicating variability in the measurements. The approximate range of the error bars is consistent across points for a given series, spanning roughly ±15-25% of the central value.
### Key Observations
1. **Consistent Hierarchy:** The performance order of the algorithms is consistent across all measured values of `n`. From most efficient (fewest evaluations) to least efficient: `NSGA-II, N=2(n+1)` < `GSEMO` ≈ `NSGA-II, N=4(n+1)` < `NSGA-II, N=8(n+1)`.
2. **Exponential Growth:** The straight lines on the log-linear plot confirm that runtime (fitness evaluations) grows exponentially with `n` for all tested methods.
3. **Impact of Population Size (N):** For the NSGA-II algorithm, increasing the population size multiplier (from 2 to 4 to 8) consistently increases the computational cost. The `N=8(n+1)` configuration is the most expensive.
4. **GSEMO vs. NSGA-II:** The GSEMO algorithm's performance lies between the `N=2(n+1)` and `N=4(n+1)` configurations of NSGA-II. It is less efficient than the smallest-population NSGA-II but more efficient than the larger-population variants.
### Interpretation
This chart demonstrates the scalability of different evolutionary algorithms on the LOTZ benchmark problem. The key insight is that while all methods face exponential growth in runtime with problem size, their constant factors differ significantly.
The data suggests a trade-off within the NSGA-II framework: using a larger population (`N`) likely improves solution quality or convergence reliability (not shown here) but comes at a direct, proportional cost in fitness evaluations. The most parsimonious configuration (`N=2(n+1)`) is the most runtime-efficient.
The GSEMO algorithm presents an interesting middle ground. Its performance being bracketed by two NSGA-II variants suggests its search dynamics have an effective "exploration-exploitation" balance that results in a computational cost similar to an NSGA-II run with a population size between `2(n+1)` and `4(n+1)`.
The consistent exponential trend implies that for very large `n`, the absolute difference in runtime between these methods will become enormous, making algorithm selection critical for large-scale problems. The chart does not show which method finds better solutions, only their relative computational cost.