## Bar Chart: SHD Test Accuracy vs. Sparsity Regularization Constant
### Overview
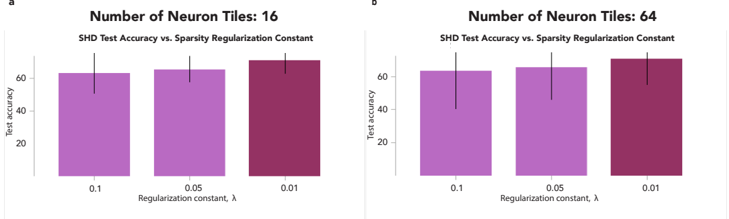
The image presents two bar charts comparing SHD (Spiking Hebbian Dynamics) test accuracy against different sparsity regularization constants (lambda). The chart on the left represents results with 16 neuron tiles, while the chart on the right represents results with 64 neuron tiles. Each chart displays test accuracy for regularization constants of 0.1, 0.05, and 0.01. Error bars are included to indicate the variability in the test accuracy.
### Components/Axes
* **Titles:**
* Left Chart: "Number of Neuron Tiles: 16"
* Right Chart: "Number of Neuron Tiles: 64"
* Both Charts: "SHD Test Accuracy vs. Sparsity Regularization Constant"
* **Y-axis:**
* Label: "Test accuracy"
* Scale: 0 to 60, with tick marks at 20, 40, and 60.
* **X-axis:**
* Label: "Regularization constant, λ"
* Categories: 0.1, 0.05, 0.01
* **Bar Colors:**
* 0.1: Light Purple
* 0.05: Medium Purple
* 0.01: Dark Purple
### Detailed Analysis
**Chart A (16 Neuron Tiles):**
* **Regularization Constant 0.1 (Light Purple):**
* Test accuracy: Approximately 62
* Error bar extends from approximately 42 to 72.
* **Regularization Constant 0.05 (Medium Purple):**
* Test accuracy: Approximately 64
* Error bar extends from approximately 54 to 74.
* **Regularization Constant 0.01 (Dark Purple):**
* Test accuracy: Approximately 68
* Error bar extends from approximately 58 to 78.
**Chart B (64 Neuron Tiles):**
* **Regularization Constant 0.1 (Light Purple):**
* Test accuracy: Approximately 62
* Error bar extends from approximately 42 to 72.
* **Regularization Constant 0.05 (Medium Purple):**
* Test accuracy: Approximately 64
* Error bar extends from approximately 54 to 74.
* **Regularization Constant 0.01 (Dark Purple):**
* Test accuracy: Approximately 68
* Error bar extends from approximately 58 to 78.
### Key Observations
* In both charts, test accuracy appears to increase slightly as the regularization constant (lambda) decreases from 0.1 to 0.01.
* The error bars are relatively large, indicating substantial variability in the test accuracy for each regularization constant.
* The test accuracy values and error bar ranges are nearly identical between the 16 neuron tiles and 64 neuron tiles configurations.
### Interpretation
The data suggests that decreasing the sparsity regularization constant (lambda) from 0.1 to 0.01 may lead to a slight improvement in SHD test accuracy, regardless of whether 16 or 64 neuron tiles are used. However, the large error bars indicate that this improvement may not be statistically significant. The similarity in results between the 16 and 64 neuron tile configurations suggests that increasing the number of neuron tiles from 16 to 64 does not significantly impact the test accuracy within the tested range of regularization constants. The error bars are large, which could be due to a number of factors, including the inherent variability in the SHD algorithm, the size of the test dataset, or the specific parameters used in the simulation. Further investigation with more data points and statistical analysis would be needed to confirm these trends and determine the optimal regularization constant for maximizing test accuracy.