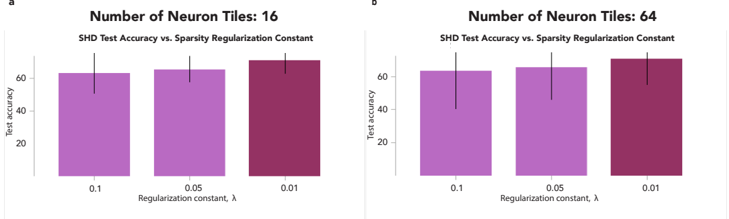
## Bar Charts: SHD Test Accuracy vs. Sparsity Regularization Constant
### Overview
The image contains two side-by-side bar charts comparing SHD test accuracy across three sparsity regularization constants (λ = 0.1, 0.05, 0.01) for neural networks with 16 and 64 neuron tiles. Test accuracy is measured on the y-axis (0–80%), while λ values are plotted on the x-axis. Error bars indicate variability in test accuracy.
### Components/Axes
- **Chart (a)**:
- Title: "Number of Neuron Tiles: 16"
- X-axis: "Regularization constant, λ" (values: 0.1, 0.05, 0.01)
- Y-axis: "Test accuracy" (0–80%)
- Bars: Purple (λ = 0.1), Maroon (λ = 0.05), Dark Purple (λ = 0.01)
- Error bars: Vertical lines atop each bar.
- **Chart (b)**:
- Title: "Number of Neuron Tiles: 64"
- X-axis: Same λ values as chart (a).
- Y-axis: Same scale as chart (a).
- Bars: Identical color coding as chart (a).
### Detailed Analysis
#### Chart (a): 16 Neuron Tiles
- **λ = 0.1**: Test accuracy ≈ 60% (error range: ~55–65%).
- **λ = 0.05**: Test accuracy ≈ 62% (error range: ~58–66%).
- **λ = 0.01**: Test accuracy ≈ 65% (error range: ~60–70%).
#### Chart (b): 64 Neuron Tiles
- **λ = 0.1**: Test accuracy ≈ 62% (error range: ~57–67%).
- **λ = 0.05**: Test accuracy ≈ 64% (error range: ~60–68%).
- **λ = 0.01**: Test accuracy ≈ 68% (error range: ~63–73%).
### Key Observations
1. **Higher neuron tiles improve accuracy**: For all λ values, test accuracy increases when neuron tiles double from 16 to 64.
2. **Regularization strength impacts accuracy**: Lower λ values (stronger regularization) generally yield higher accuracy, with the largest gains observed at λ = 0.01.
3. **Error variability**: Test accuracy variability (error bars) increases slightly with lower λ values, particularly in chart (b).
### Interpretation
The data suggests that increasing the number of neuron tiles enhances model performance, likely due to greater capacity to capture complex patterns. Stronger regularization (lower λ) further improves accuracy, possibly by reducing overfitting. However, the trade-off between regularization strength and model complexity is evident: while λ = 0.01 achieves the highest accuracy, it may risk underfitting if applied excessively. The error bars highlight the importance of statistical validation, as accuracy estimates vary within ±3–5% ranges.
**Note**: No explicit legend is present, but color coding (purple → maroon → dark purple) consistently maps to λ values across both charts. Spatial grounding confirms charts (a) and (b) are aligned horizontally, with titles and axes labeled identically for direct comparison.