## Bar Chart: Improvements of Accuracy (%) by Model
### Overview
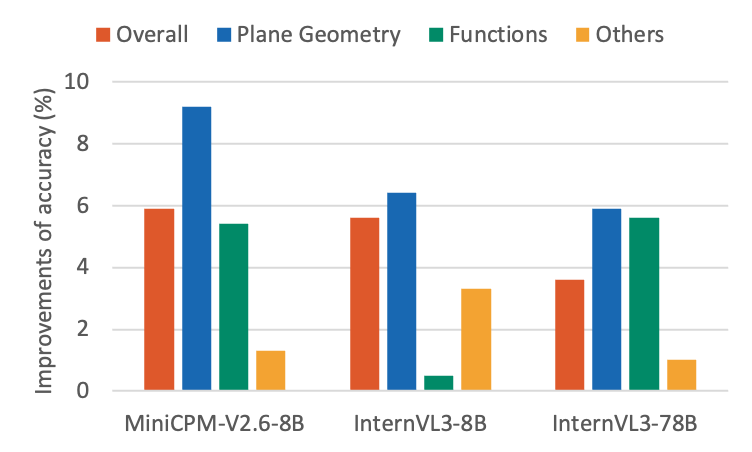
The image is a grouped bar chart illustrating the "Improvements of accuracy (%)" for three different AI models: MiniCPM-V2.6-8B, InternVL3-8B, and InternVL3-78B. The chart breaks down these improvements into four distinct categories: Overall, Plane Geometry, Functions, and Others.
### Components/Axes
* **Y-Axis:** Labeled "Improvements of accuracy (%)". The scale ranges from 0 to 10, with horizontal grid lines marking increments of 2.
* **X-Axis:** Categorical, displaying the three models being compared:
* MiniCPM-V2.6-8B
* InternVL3-8B
* InternVL3-78B
* **Legend:** Positioned at the top of the chart, identifying the data series by color:
* **Red/Orange:** Overall
* **Blue:** Plane Geometry
* **Green:** Functions
* **Yellow/Gold:** Others
### Detailed Analysis
The following values are approximate based on visual estimation against the Y-axis grid lines:
| Model | Overall (Red) | Plane Geometry (Blue) | Functions (Green) | Others (Yellow) |
| :--- | :--- | :--- | :--- | :--- |
| **MiniCPM-V2.6-8B** | ~5.9% | ~9.2% | ~5.4% | ~1.3% |
| **InternVL3-8B** | ~5.6% | ~6.4% | ~0.5% | ~3.3% |
| **InternVL3-78B** | ~3.6% | ~5.9% | ~5.6% | ~1.0% |
### Key Observations
* **Plane Geometry Strength:** "Plane Geometry" consistently shows the highest or near-highest improvement across all three models, suggesting these models are particularly effective at geometric reasoning tasks.
* **Functions Anomaly:** There is a significant performance disparity in the "Functions" category. While MiniCPM-V2.6-8B and InternVL3-78B show strong improvements (~5.4% and ~5.6% respectively), InternVL3-8B shows a negligible improvement of ~0.5%.
* **Model Scaling:** The largest model, InternVL3-78B, does not demonstrate the highest "Overall" improvement. In fact, it shows the lowest "Overall" improvement (~3.6%) compared to the two 8B models (~5.6%–5.9%).
* **"Others" Category:** This category consistently yields low improvement scores across all models, generally remaining below 3.5%.
### Interpretation
The data suggests that model size (parameter count) is not the primary driver for accuracy improvements in these specific domains. The 8B models are outperforming the 78B model in the "Overall" metric, which implies that the smaller models may be more specialized or better optimized for the specific test set used.
The most notable anomaly is the "Functions" category for the InternVL3-8B model. The near-zero improvement suggests a potential regression, a lack of training data in that specific domain, or a failure in the model's ability to generalize for functional reasoning tasks compared to its peers. Conversely, the high performance of all models in "Plane Geometry" indicates that this is a shared strength across the tested architectures.