\n
## Grouped Bar Chart: Accuracy Improvements by Model and Math Category
### Overview
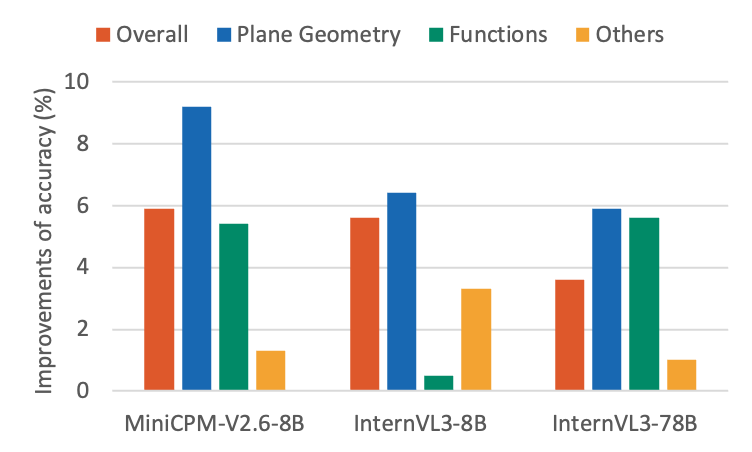
The image displays a grouped bar chart comparing the percentage improvements in accuracy for three different AI models across four mathematical categories. The chart is presented on a white background with a clear legend and labeled axes.
### Components/Axes
* **Chart Type:** Grouped Bar Chart.
* **Y-Axis:** Labeled "Improvements of accuracy (%)". The scale runs from 0 to 10, with major grid lines at intervals of 2 (0, 2, 4, 6, 8, 10).
* **X-Axis:** Lists three distinct AI models:
1. MiniCPM-V2.6-8B
2. InternVL3-8B
3. InternVL3-78B
* **Legend:** Located at the top of the chart, centered. It defines four data series by color:
* **Overall** (Red/Orange)
* **Plane Geometry** (Blue)
* **Functions** (Green)
* **Others** (Yellow/Gold)
* **Data Series:** For each model on the x-axis, there are four bars corresponding to the categories in the legend, ordered from left to right: Overall, Plane Geometry, Functions, Others.
### Detailed Analysis
**Model 1: MiniCPM-V2.6-8B**
* **Overall (Red):** Approximately 6.0% improvement.
* **Plane Geometry (Blue):** The highest bar in this group and the entire chart. Approximately 9.2% improvement.
* **Functions (Green):** Approximately 5.5% improvement.
* **Others (Yellow):** The lowest bar for this model. Approximately 1.5% improvement.
* **Trend:** Plane Geometry shows a dominant improvement, significantly outperforming the other categories. "Others" shows minimal gain.
**Model 2: InternVL3-8B**
* **Overall (Red):** Approximately 5.6% improvement.
* **Plane Geometry (Blue):** Approximately 6.5% improvement.
* **Functions (Green):** A very low bar, approximately 0.5% improvement.
* **Others (Yellow):** Approximately 3.5% improvement.
* **Trend:** Plane Geometry again shows the highest improvement, but the gap is smaller. The "Functions" category shows a dramatic drop to near-zero improvement compared to the MiniCPM model. "Others" shows a moderate improvement.
**Model 3: InternVL3-78B**
* **Overall (Red):** Approximately 3.6% improvement.
* **Plane Geometry (Blue):** Approximately 6.0% improvement.
* **Functions (Green):** Approximately 5.6% improvement.
* **Others (Yellow):** Approximately 1.0% improvement.
* **Trend:** Plane Geometry and Functions show similar, strong improvements. The "Overall" improvement is lower than the other two models. "Others" remains the lowest category.
### Key Observations
1. **Plane Geometry Dominance:** The "Plane Geometry" category (blue bar) consistently shows the highest or near-highest accuracy improvement across all three models.
2. **Functions Volatility:** The "Functions" category (green bar) shows high variability. It is strong for MiniCPM-V2.6-8B (~5.5%) and InternVL3-78B (~5.6%), but collapses to near zero (~0.5%) for InternVL3-8B.
3. **"Others" Category:** This category (yellow bar) consistently yields the lowest or second-lowest improvement, suggesting the models' enhancements are more specialized in the core mathematical domains listed.
4. **Model Comparison:** MiniCPM-V2.6-8B achieves the single highest category improvement (Plane Geometry). InternVL3-78B shows the most balanced high performance between Plane Geometry and Functions. InternVL3-8B has a notable weakness in Functions.
### Interpretation
The data suggests that the evaluated AI models have undergone targeted improvements that are not uniform across mathematical domains. The consistent strength in **Plane Geometry** indicates this may be a domain where recent architectural or training advancements yield significant gains. The stark volatility in the **Functions** category for the InternVL3-8B model is a critical anomaly; it implies a potential regression, a specialized training focus that omitted this area, or a sensitivity in the model's architecture to function-related problems that was later addressed in the larger 78B variant.
The relatively low scores for **"Others"** imply that the benchmark or the models' improvements are concentrated on well-defined, core mathematical competencies rather than miscellaneous or applied problems. The "Overall" metric, while useful, masks these important domain-specific variations, highlighting the necessity of disaggregated evaluation. The chart effectively demonstrates that model size (8B vs. 78B) does not linearly correlate with improvement in every category, as seen by the InternVL3-8B's poor performance in Functions compared to both the smaller MiniCPM and its larger sibling.