## Box Plot Chart: Model Performance Comparison Across Metrics
### Overview
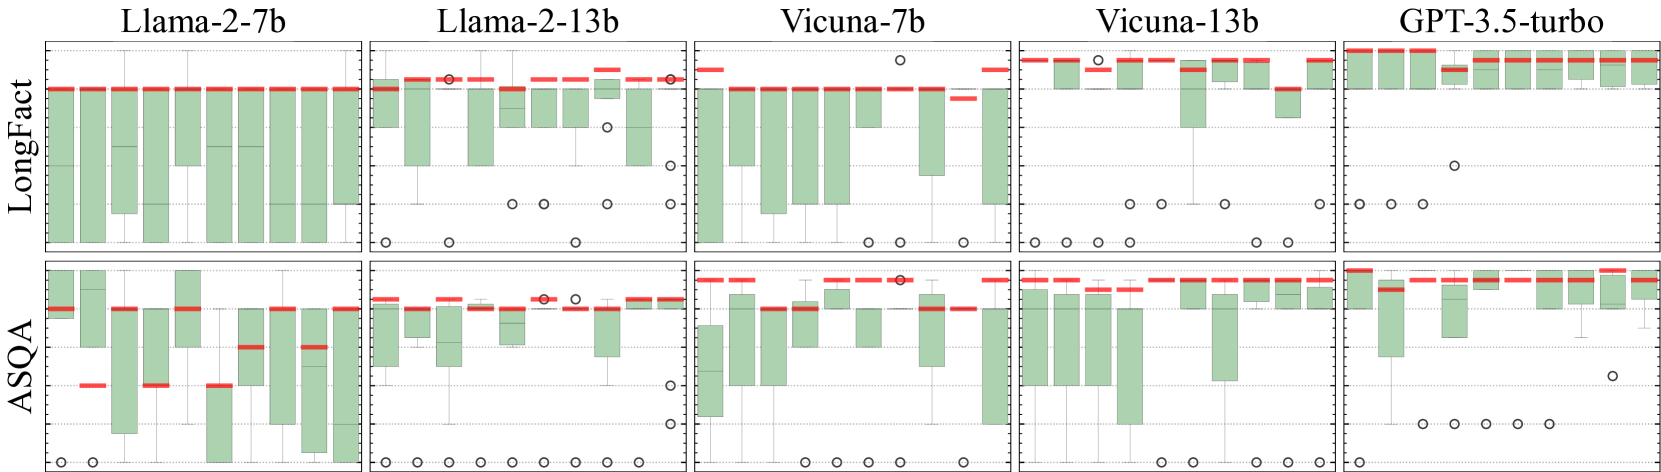
The image displays a grouped box plot comparing the performance of five language models (Llama-2-7b, Llama-2-13b, Vicuna-7b, Vicuna-13b, GPT-3.5-turbo) across two metrics: **LongFact** (top row) and **ASQA** (bottom row). Each box plot shows the distribution of values, with red lines representing medians, green boxes indicating interquartile ranges (IQRs), and open circles denoting outliers.
### Components/Axes
- **X-axis**: Model names (Llama-2-7b, Llama-2-13b, Vicuna-7b, Vicuna-13b, GPT-3.5-turbo).
- **Y-axis**: Labeled "Value" (no explicit scale, but values range approximately from -0.5 to 1.0 based on box plot positions).
- **Legend**: Not explicitly labeled, but visual conventions apply:
- **Red lines**: Medians.
- **Green boxes**: Interquartile ranges (IQR).
- **Open circles**: Outliers.
- **Rows**:
- **Top row**: LongFact metric.
- **Bottom row**: ASQA metric.
### Detailed Analysis
#### LongFact Metric (Top Row)
1. **Llama-2-7b**:
- Median ≈ 0.5 (red line).
- IQR spans ~0.3 to 0.7.
- No outliers.
2. **Llama-2-13b**:
- Median ≈ 0.6.
- IQR spans ~0.4 to 0.8.
- One outlier at ~0.9.
3. **Vicuna-7b**:
- Median ≈ 0.5.
- IQR spans ~0.3 to 0.7.
- One outlier at ~0.9.
4. **Vicuna-13b**:
- Median ≈ 0.6.
- IQR spans ~0.4 to 0.8.
- One outlier at ~0.9.
5. **GPT-3.5-turbo**:
- Median ≈ 0.7.
- IQR spans ~0.5 to 0.9.
- No outliers.
#### ASQA Metric (Bottom Row)
1. **Llama-2-7b**:
- Median ≈ 0.4.
- IQR spans ~0.2 to 0.6.
- One outlier at ~0.8.
2. **Llama-2-13b**:
- Median ≈ 0.5.
- IQR spans ~0.3 to 0.7.
- One outlier at ~0.9.
3. **Vicuna-7b**:
- Median ≈ 0.5.
- IQR spans ~0.3 to 0.7.
- One outlier at ~0.9.
4. **Vicuna-13b**:
- Median ≈ 0.6.
- IQR spans ~0.4 to 0.8.
- One outlier at ~0.9.
5. **GPT-3.5-turbo**:
- Median ≈ 0.7.
- IQR spans ~0.5 to 0.9.
- One outlier at ~1.0.
### Key Observations
- **Median Trends**:
- GPT-3.5-turbo consistently shows the highest medians in both metrics.
- Llama-2-13b and Vicuna-13b outperform smaller models (7b variants) in both metrics.
- **Outliers**:
- Outliers are rare but present in Llama-2-13b, Vicuna-7b, and GPT-3.5-turbo.
- Outliers in ASQA for GPT-3.5-turbo reach the upper bound of the y-axis (~1.0).
- **Variability**:
- Larger models (13b) exhibit tighter IQRs, suggesting more consistent performance.
- Smaller models (7b) show wider IQRs, indicating higher variability.
### Interpretation
The data suggests that **larger models (13b)** generally outperform smaller models (7b) in both **LongFact** and **ASQA** metrics, with GPT-3.5-turbo achieving the highest median performance. The presence of outliers in some models (e.g., Llama-2-13b, GPT-3.5-turbo) may indicate edge cases or anomalies in specific evaluations. The tighter IQRs for larger models imply greater reliability, while smaller models show more variability, potentially due to limited capacity or training data. The absence of a legend complicates direct interpretation of colors, but standard box plot conventions were applied.