## Error Bar Chart: Myopic vs. Non-Myopic Behavior
### Overview
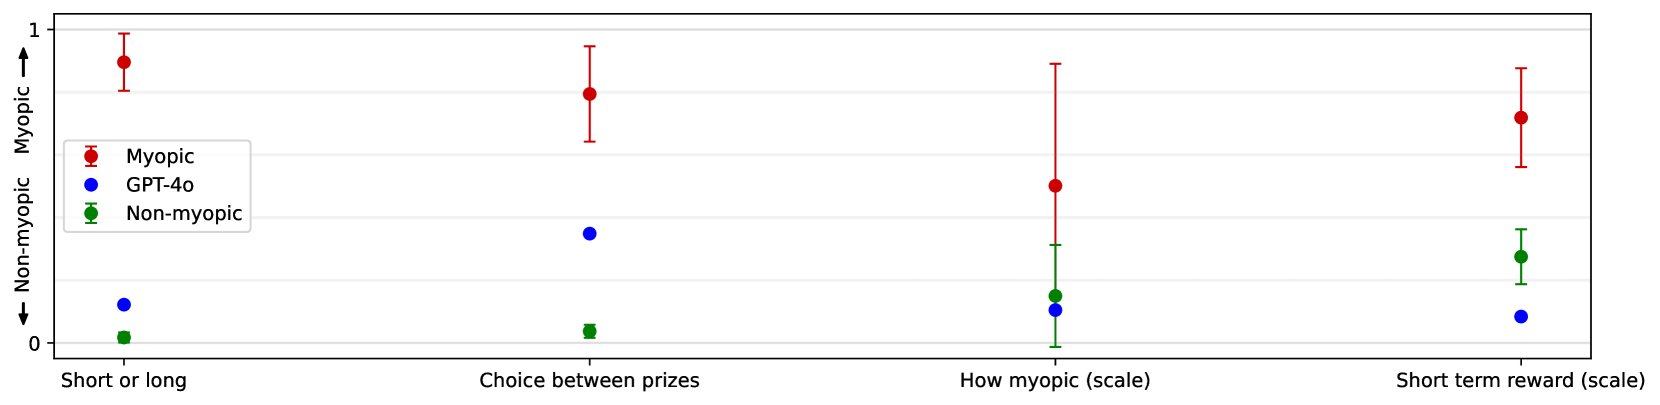
The image is an error bar chart comparing the "Myopic", "GPT-4o", and "Non-myopic" behaviors across four different scenarios: "Short or long", "Choice between prizes", "How myopic (scale)", and "Short term reward (scale)". The y-axis represents the degree of myopic behavior, ranging from 0 (Non-myopic) to 1 (Myopic). The chart displays the mean and standard deviation for each category.
### Components/Axes
* **X-axis:** Categorical axis with four categories: "Short or long", "Choice between prizes", "How myopic (scale)", and "Short term reward (scale)".
* **Y-axis:** Numerical axis representing the degree of myopic behavior, ranging from 0 to 1. The axis is labeled with arrows indicating the direction of "Non-myopic" (towards 0) and "Myopic" (towards 1).
* **Legend:** Located on the left side of the chart, associating colors with behavior types:
* Red: "Myopic"
* Blue: "GPT-4o"
* Green: "Non-myopic"
### Detailed Analysis
**1. Short or long**
* **Myopic (Red):** The mean value is approximately 0.9, with an error bar extending from roughly 0.7 to 1.
* **GPT-4o (Blue):** The mean value is approximately 0.1, with a small error bar.
* **Non-myopic (Green):** The mean value is approximately 0.02, with a small error bar.
**2. Choice between prizes**
* **Myopic (Red):** The mean value is approximately 0.8, with an error bar extending from roughly 0.65 to 0.95.
* **GPT-4o (Blue):** The mean value is approximately 0.3, with a small error bar.
* **Non-myopic (Green):** The mean value is approximately 0.03, with a small error bar.
**3. How myopic (scale)**
* **Myopic (Red):** The mean value is approximately 0.5, with an error bar extending from roughly 0.1 to 0.9.
* **GPT-4o (Blue):** The mean value is approximately 0.1, with a small error bar.
* **Non-myopic (Green):** The mean value is approximately 0.15, with an error bar extending from roughly 0 to 0.3.
**4. Short term reward (scale)**
* **Myopic (Red):** The mean value is approximately 0.75, with an error bar extending from roughly 0.6 to 0.9.
* **GPT-4o (Blue):** The mean value is approximately 0.1, with a small error bar.
* **Non-myopic (Green):** The mean value is approximately 0.2, with an error bar extending from roughly 0.1 to 0.3.
### Key Observations
* The "Myopic" behavior consistently shows higher values across all scenarios, indicating a stronger preference for immediate rewards.
* The "GPT-4o" behavior consistently shows low values across all scenarios, indicating a weaker preference for immediate rewards.
* The "Non-myopic" behavior consistently shows low values across all scenarios, indicating a weaker preference for immediate rewards.
* The error bars for the "Myopic" behavior are generally larger than those for "GPT-4o" and "Non-myopic", suggesting greater variability in the "Myopic" responses.
### Interpretation
The chart suggests that the "Myopic" behavior is significantly more prone to prioritizing immediate rewards compared to the "GPT-4o" and "Non-myopic" behaviors. The "GPT-4o" and "Non-myopic" behaviors exhibit similar tendencies, both showing a preference for delayed gratification or long-term planning. The larger error bars for the "Myopic" behavior could indicate that this behavior is more context-dependent or influenced by individual differences. The scenarios "Short or long" and "Choice between prizes" elicit the most pronounced differences between the "Myopic" behavior and the other two. The "How myopic (scale)" scenario shows the least difference between the "Myopic" behavior and the other two.