## Line Chart: Decision-Making Tendencies Across Categories
### Overview
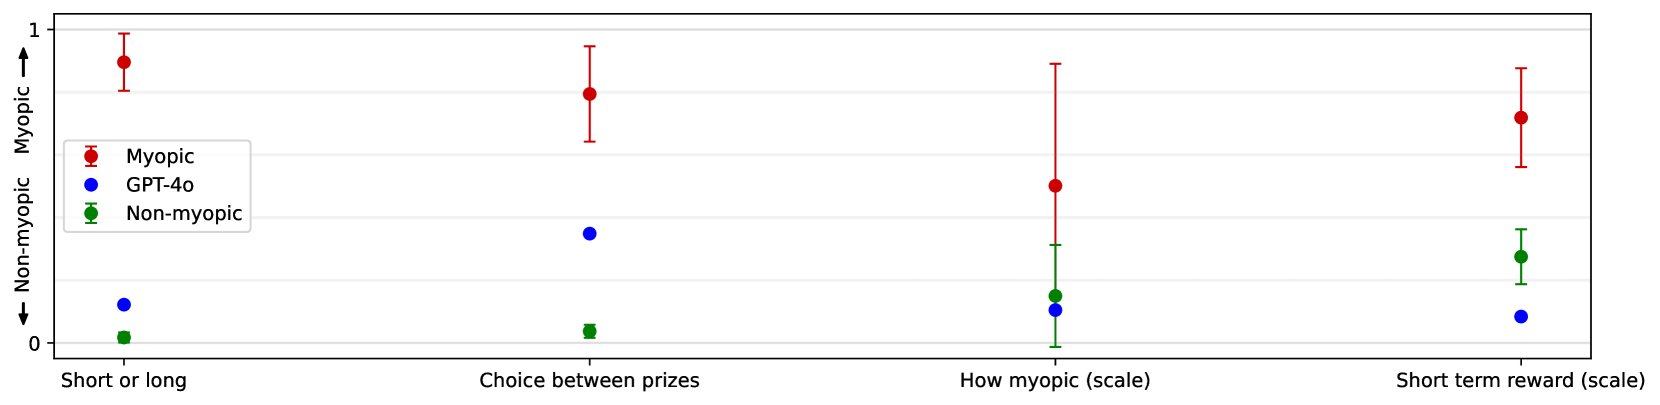
The chart visualizes decision-making tendencies across four categories ("Short or long," "Choice between prizes," "How myopic (scale)," and "Short term reward (scale)") for three groups: Myopic (red), GPT-4o (blue), and Non-myopic (green). The y-axis represents a binary scale (0 to 1) labeled "Non-myopic Myopic," with error bars indicating variability.
### Components/Axes
- **X-axis**: Four categorical variables:
1. "Short or long"
2. "Choice between prizes"
3. "How myopic (scale)"
4. "Short term reward (scale)"
- **Y-axis**: Labeled "Non-myopic Myopic" (0 to 1), with upward-pointing arrows.
- **Legend**:
- Red: Myopic
- Blue: GPT-4o
- Green: Non-myopic
- **Error Bars**: Vertical lines with caps, representing confidence intervals or variability.
### Detailed Analysis
1. **"Short or long"**:
- Myopic (red): ~0.9 (error bar: 0.8–1.0)
- GPT-4o (blue): ~0.2 (error bar: 0.1–0.3)
- Non-myopic (green): ~0.0 (error bar: 0.0–0.1)
2. **"Choice between prizes"**:
- Myopic (red): ~0.8 (error bar: 0.7–0.9)
- GPT-4o (blue): ~0.4 (error bar: 0.3–0.5)
- Non-myopic (green): ~0.1 (error bar: 0.0–0.2)
3. **"How myopic (scale)"**:
- Myopic (red): ~0.6 (error bar: 0.5–0.7)
- GPT-4o (blue): ~0.3 (error bar: 0.2–0.4)
- Non-myopic (green): ~0.2 (error bar: 0.1–0.3)
4. **"Short term reward (scale)"**:
- Myopic (red): ~0.7 (error bar: 0.6–0.8)
- GPT-4o (blue): ~0.2 (error bar: 0.1–0.3)
- Non-myopic (green): ~0.3 (error bar: 0.2–0.4)
### Key Observations
- **Myopic (red)**: Consistently highest values across all categories, with large error bars (e.g., 0.8–1.0 in "Short or long").
- **GPT-4o (blue)**: Moderate values, with smaller error bars (e.g., 0.2–0.4 in "Choice between prizes").
- **Non-myopic (green)**: Lowest values, with error bars extending slightly higher in "Short term reward (scale)" (~0.3).
- **Error Bar Variability**: Myopic data shows the largest uncertainty, while Non-myopic has the smallest (except in "Short term reward").
### Interpretation
The data suggests that **Myopic individuals** exhibit stronger tendencies toward myopic decision-making (e.g., prioritizing short-term rewards or immediate choices) compared to **GPT-4o** (a balanced approach) and **Non-myopic** (least myopic). The error bars indicate that Myopic data is more variable, possibly due to larger sample size or greater heterogeneity in responses. The "How myopic (scale)" category shows a gradient, with Myopic values decreasing slightly compared to "Short or long," suggesting context-dependent myopia. GPT-4o’s intermediate values may reflect algorithmic or hybrid decision-making, while Non-myopic values align with long-term or rational strategies. The chart highlights a clear hierarchy in decision-making tendencies, with Myopic individuals consistently favoring immediate or short-term outcomes.