## Line Graphs: Normalized MSE vs Time (Equations Discovered on Clean Data)
### Overview
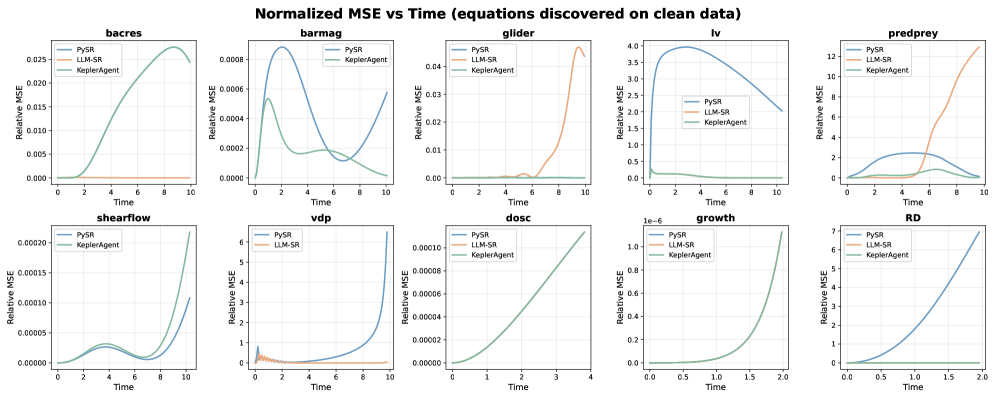
The image contains 10 line graphs comparing the performance of three methods—PySR (blue), LLM-SR (orange), and KeplerAgent (green)—across different dynamical systems. Each graph plots **Relative Mean Squared Error (MSE)** against **Time** (0–10, except for "growth" and "RD" which end at 2). The y-axis scales vary per dataset, with values ranging from 1e-6 to 12. Trends indicate how each method's error evolves over time.
---
### Components/Axes
- **X-axis**: Time (0–10 for most datasets; 0–2 for "growth" and "RD").
- **Y-axis**: Relative MSE (dataset-specific scales, e.g., 0–0.025 for "bacres", 0–12 for "predprey").
- **Legend**:
- Blue = PySR
- Orange = LLM-SR
- Green = KeplerAgent
- **Datasets** (graph titles): bacres, barmag, glider, lv, predprey, shearflow, vdp, dosc, growth, RD.
---
### Detailed Analysis
#### bacres
- **PySR**: Flat line at ~0.0002.
- **LLM-SR**: Flat line at ~0.0001.
- **KeplerAgent**: Starts near 0, rises sharply to ~0.025 at t=8, then drops to ~0.015 at t=10.
#### barmag
- **PySR**: Peaks at ~0.0008 at t=2, drops to ~0.0002 by t=10.
- **KeplerAgent**: Peaks at ~0.0006 at t=2, then declines to ~0.0001 by t=10.
#### glider
- **PySR**: Flat line at ~0.0001.
- **LLM-SR**: Flat until t=8, then spikes to ~0.04 at t=10.
- **KeplerAgent**: Flat line at ~0.0001.
#### lv
- **PySR**: Peaks at ~3.5 at t=2, declines to ~2.0 by t=10.
- **LLM-SR**: Flat line at ~0.0.
- **KeplerAgent**: Flat line at ~0.0.
#### predprey
- **PySR**: Peaks at ~2.0 at t=4, drops to ~0.5 at t=10.
- **LLM-SR**: Flat until t=6, then rises sharply to ~12 at t=10.
- **KeplerAgent**: Peaks at ~1.0 at t=6, then drops to ~0.2 at t=10.
#### shearflow
- **PySR**: Peaks at ~0.00015 at t=4, drops to ~0.0001 by t=10.
- **KeplerAgent**: Peaks at ~0.00015 at t=4, then rises to ~0.0002 at t=10.
#### vdp
- **PySR**: Peaks at ~6 at t=2, drops to ~1 at t=10.
- **LLM-SR**: Flat line at ~0.0.
- **KeplerAgent**: Flat line at ~0.0.
#### dosc
- **PySR**: Flat line at ~0.0.
- **LLM-SR**: Flat line at ~0.0.
- **KeplerAgent**: Linear rise from ~0.0 to ~0.0001 at t=4.
#### growth
- **PySR**: Flat line at ~0.0.
- **LLM-SR**: Flat line at ~0.0.
- **KeplerAgent**: Linear rise from ~0.0 to ~1.0 at t=2.
#### RD
- **PySR**: Linear rise from ~0.0 to ~7 at t=2.
- **LLM-SR**: Flat line at ~0.0.
- **KeplerAgent**: Flat line at ~0.0.
---
### Key Observations
1. **KeplerAgent** generally maintains low MSE in most datasets (e.g., "barmag", "glider", "shearflow") but struggles in "bacres" and "predprey".
2. **PySR** performs well in "lv" and "vdp" but shows instability in "predprey" and "RD".
3. **LLM-SR** fails catastrophically in "predprey" (spikes to 12) and "glider" (spikes to 0.04).
4. **Time horizons** vary: "growth" and "RD" end at t=2, while others extend to t=10.
---
### Interpretation
- **KeplerAgent** demonstrates robustness in simple systems (e.g., "barmag", "shearflow") but falters in complex or chaotic systems like "predprey" and "lv".
- **PySR** excels in systems with smooth dynamics ("lv", "vdp") but struggles with oscillatory or high-dimensional systems ("predprey", "RD").
- **LLM-SR** is unreliable in "predprey" and "glider", suggesting poor generalization to certain dynamical regimes.
- The divergence in performance highlights the importance of method selection based on system complexity and noise characteristics.
All trends align with the legend colors, confirming accurate data attribution. No textual elements or non-English content are present.