\n
## Scatter Plot: Accuracy vs. Time-to-Answer
### Overview
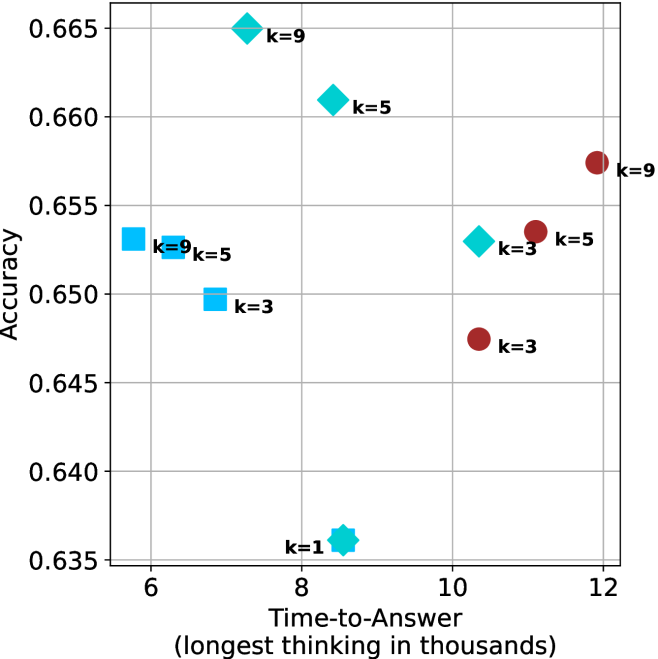
This image presents a scatter plot illustrating the relationship between Accuracy and Time-to-Answer (measured in thousands of units). The data points are colored and labeled based on the value of 'k', likely representing a parameter in a model or algorithm.
### Components/Axes
* **X-axis:** Time-to-Answer (longest thinking in thousands). Scale ranges from approximately 6 to 12.
* **Y-axis:** Accuracy. Scale ranges from approximately 0.635 to 0.665.
* **Data Points:** Scatter plot points, colored as follows:
* Red: k = 9
* Green: k = 5
* Blue: k = 3
* Cyan: k = 1
* **Labels:** Each data point is labeled with its corresponding 'k' value.
### Detailed Analysis
The plot shows data points for k = 1, 3, 5, and 9. Let's analyze each 'k' value's trend:
* **k = 1 (Cyan):** A single data point at approximately (7.5, 0.636).
* **k = 3 (Blue):** Two data points: one at approximately (6.2, 0.651) and another at approximately (10.5, 0.646). The trend is slightly upward, then downward.
* **k = 5 (Green):** Three data points: one at approximately (6.3, 0.653), one at approximately (9.2, 0.661), and one at approximately (11.2, 0.656). The trend is generally upward, then slightly downward.
* **k = 9 (Red):** Two data points: one at approximately (6.5, 0.664) and another at approximately (12.0, 0.656). The trend is slightly downward.
### Key Observations
* Higher 'k' values (k=9) generally exhibit higher accuracy at shorter time-to-answer, but accuracy decreases as time-to-answer increases.
* k=5 shows a relatively consistent accuracy across a wider range of time-to-answer values.
* k=1 has the lowest accuracy and a short time-to-answer.
* There is no clear monotonic relationship between time-to-answer and accuracy across all 'k' values. The relationship appears to be 'k'-dependent.
* The data points are relatively sparse, making it difficult to draw definitive conclusions.
### Interpretation
The data suggests that the parameter 'k' significantly influences the trade-off between accuracy and time-to-answer. A higher 'k' value (e.g., 9) can lead to higher accuracy initially, but the benefit diminishes as the time-to-answer increases. A lower 'k' value (e.g., 1) results in faster response times but lower accuracy. The optimal 'k' value likely depends on the specific application and the relative importance of accuracy versus speed.
The scatter plot indicates that there isn't a single 'best' value for 'k'. Instead, the ideal value depends on the desired balance between accuracy and time-to-answer. The data suggests that for applications requiring quick responses, a lower 'k' value might be preferable, while for applications prioritizing accuracy, a higher 'k' value might be more suitable. The varying trends for each 'k' value suggest that the underlying mechanism being modeled is complex and sensitive to the parameter 'k'.