TECHNICAL ASSET FINGERPRINT
8c99fd2e67bbba826904339d
Click to view fullscreen
Press ESC or click to close
FOUND IN PAPERS
EXPERT: healer-alpha-free VERSION 1
RUNTIME: free/openrouter/healer-alpha
INTEL_VERIFIED
## Scatter Plot: Accuracy vs. Time-to-Answer for Different 'k' Values
### Overview
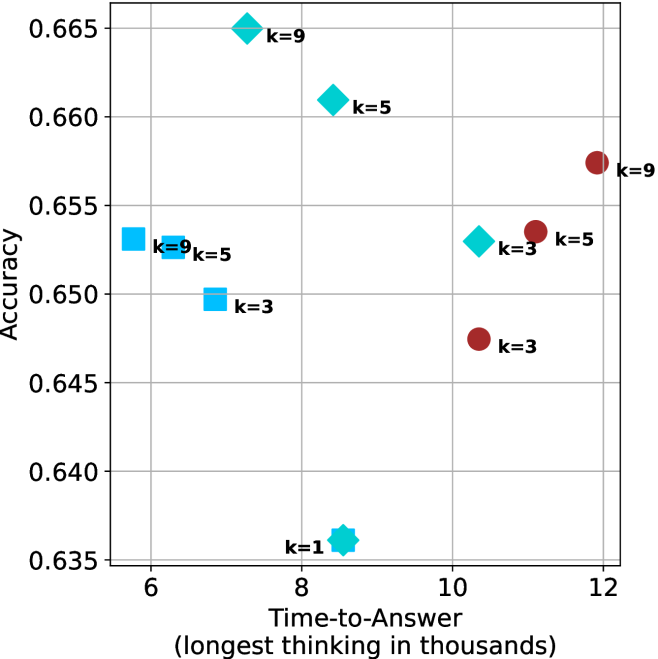
The image is a scatter plot comparing the performance of different configurations, labeled by a parameter 'k', across two metrics: **Accuracy** (y-axis) and **Time-to-Answer** (x-axis). The plot displays nine distinct data points, each represented by a specific marker shape and color, and labeled with its corresponding 'k' value. The data suggests a comparison of different algorithms, models, or settings where 'k' is a key variable.
### Components/Axes
* **X-Axis:**
* **Label:** "Time-to-Answer (longest thinking in thousands)"
* **Scale:** Linear, ranging from approximately 6 to 12. Major tick marks are at 6, 8, 10, and 12.
* **Interpretation:** Represents the computational time or latency, measured in thousands of units (e.g., tokens, steps, or milliseconds). Higher values indicate slower performance.
* **Y-Axis:**
* **Label:** "Accuracy"
* **Scale:** Linear, ranging from approximately 0.635 to 0.665. Major tick marks are at 0.635, 0.640, 0.645, 0.650, 0.655, 0.660, and 0.665.
* **Interpretation:** Represents a performance metric, likely a proportion or score (e.g., 66.5% accuracy). Higher values indicate better performance.
* **Data Series & Legend (Inferred from Markers):**
* There is no explicit legend box. The marker shapes and colors differentiate data series, and each point is directly labeled with its 'k' value.
* **Cyan Squares:** Three points labeled k=9, k=5, k=3.
* **Cyan Diamonds:** Three points labeled k=9, k=5, k=3.
* **Cyan Star:** One point labeled k=1.
* **Red Circles:** Three points labeled k=3, k=5, k=9.
* **Spatial Grounding:** The cyan markers are clustered on the left side of the plot (Time-to-Answer ~6-8.5). The red circles are clustered on the right side (Time-to-Answer ~10.5-12). The single cyan star is an outlier at the bottom-center.
### Detailed Analysis
**Data Point Extraction (Approximate Coordinates):**
The following table lists each data point by its inferred series (marker), label, and approximate (x, y) coordinates.
| Marker & Color | Label | Approx. Time-to-Answer (x) | Approx. Accuracy (y) | Position in Plot |
| :--- | :--- | :--- | :--- | :--- |
| Cyan Square | k=9 | 6.0 | 0.653 | Leftmost, mid-height |
| Cyan Square | k=5 | 6.5 | 0.652 | Left, slightly lower |
| Cyan Square | k=3 | 7.0 | 0.650 | Left, lower |
| Cyan Diamond | k=9 | 7.5 | 0.665 | **Highest accuracy point** |
| Cyan Diamond | k=5 | 8.5 | 0.661 | Upper-center |
| Cyan Star | k=1 | 8.5 | 0.636 | **Lowest accuracy point**, bottom-center |
| Cyan Diamond | k=3 | 10.5 | 0.653 | Center-right, mid-height |
| Red Circle | k=3 | 10.5 | 0.647 | Center-right, lower |
| Red Circle | k=5 | 11.0 | 0.654 | Right, mid-height |
| Red Circle | k=9 | 12.0 | 0.657 | **Rightmost point** |
**Trend Verification:**
* **Cyan Squares (k=9,5,3):** This series shows a **downward trend**. As Time-to-Answer increases from ~6 to 7, Accuracy decreases from ~0.653 to ~0.650.
* **Cyan Diamonds (k=9,5,3):** This series also shows a **downward trend**. As Time-to-Answer increases from ~7.5 to 10.5, Accuracy decreases from ~0.665 to ~0.653.
* **Red Circles (k=3,5,9):** This series shows a clear **upward trend**. As Time-to-Answer increases from ~10.5 to 12, Accuracy increases from ~0.647 to ~0.657.
* **Cyan Star (k=1):** This is a single, isolated point with the lowest accuracy and a moderate Time-to-Answer.
### Key Observations
1. **Performance Clusters:** The data forms two distinct clusters based on Time-to-Answer. The "Cyan" group (squares, diamonds, star) operates in a faster regime (6-10.5), while the "Red Circle" group operates in a slower regime (10.5-12).
2. **Accuracy vs. Speed Trade-off:** Within the Cyan group, higher 'k' values (e.g., k=9) tend to achieve higher accuracy but at a slightly increased time cost compared to lower 'k' values in the same series. However, the overall trend for the Cyan group is that increased time correlates with decreased accuracy.
3. **Opposing Trends:** The most striking observation is the **opposite correlation** between the two main clusters. For the Cyan group, more time is associated with *lower* accuracy. For the Red Circle group, more time is associated with *higher* accuracy.
4. **Outlier:** The k=1 point (Cyan Star) is a significant outlier, having the worst accuracy despite a mid-range time cost, suggesting this configuration is highly inefficient.
5. **Peak Performance:** The highest accuracy (~0.665) is achieved by the Cyan Diamond with k=9 at a Time-to-Answer of ~7.5. The fastest time (~6) is achieved by the Cyan Square with k=9, with respectable accuracy (~0.653).
### Interpretation
This chart likely visualizes the performance of different **inference strategies or model configurations** (denoted by 'k') for an AI system, plotting their effectiveness (Accuracy) against their computational cost (Time-to-Answer).
* **What the data suggests:** The opposing trends between the Cyan and Red groups imply they represent fundamentally different approaches. The **Cyan group** might be a family of **efficient, approximate methods** (e.g., different levels of pruning, quantization, or a retrieval-based system where 'k' is the number of retrieved documents). Here, spending more time (higher 'k') within this efficient paradigm yields diminishing or negative returns on accuracy. The **Red Circle group** could represent a **more exhaustive, precise method** (e.g., a larger model, a different algorithm, or a chain-of-thought process). For this method, investing more time (which correlates with higher 'k', perhaps meaning more reasoning steps) directly translates to better accuracy.
* **How elements relate:** The parameter 'k' is not a universal dial. Its effect on the accuracy-time trade-off is entirely dependent on which method (Cyan vs. Red) it is applied to. This highlights that optimization is context-specific.
* **Notable Implications:** The chart presents a clear decision matrix. If the priority is **maximum accuracy** regardless of speed, the Red Circle method with k=9 is a strong candidate. If the priority is **high accuracy under strict time constraints**, the Cyan Diamond with k=9 is optimal. The k=1 configuration should be avoided. The data argues against a one-size-fits-all approach to tuning 'k' and underscores the importance of selecting the right underlying strategy for the given operational constraints (speed vs. precision).
DECODING INTELLIGENCE...