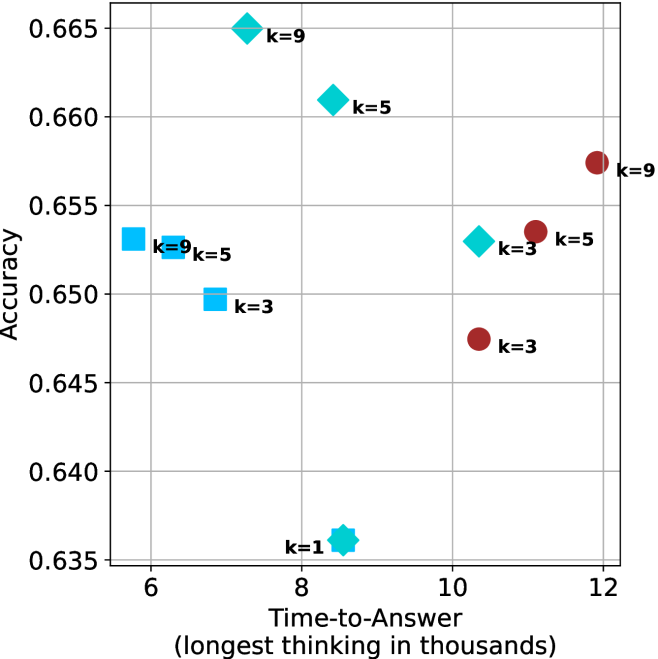
## Scatter Plot: Accuracy vs. Time-to-Answer for Different k Values
### Overview
The image is a scatter plot comparing **accuracy** (y-axis) and **time-to-answer** (x-axis, in thousands of units) for different values of a parameter **k**. Data points are color-coded and shaped by **k** values (k=1, 3, 5, 9), with a legend on the right. The plot suggests a trade-off between accuracy and computational time.
---
### Components/Axes
- **X-axis (Time-to-Answer)**: Labeled "Time-to-Answer (longest thinking in thousands)", ranging from 6 to 12.
- **Y-axis (Accuracy)**: Labeled "Accuracy", ranging from 0.635 to 0.665.
- **Legend**: Located on the right, mapping:
- **Blue squares**: k=3
- **Cyan diamonds**: k=5
- **Red circles**: k=9
- **Star symbol**: k=1
---
### Detailed Analysis
#### Data Points
1. **k=1** (Star, cyan):
- Position: (8, 0.635)
- Note: Lowest accuracy and shortest time-to-answer.
2. **k=3** (Blue squares):
- (6, 0.65)
- (7, 0.65)
- (10, 0.65)
- (11, 0.645)
- Note: Consistent accuracy (~0.65) with moderate time-to-answer.
3. **k=5** (Cyan diamonds):
- (7, 0.66)
- (9, 0.66)
- (10, 0.655)
- Note: Highest accuracy (~0.66) with mid-to-long time-to-answer.
4. **k=9** (Red circles):
- (6, 0.65)
- (12, 0.655)
- Note: High accuracy (~0.65–0.655) with the longest time-to-answer.
---
### Key Observations
1. **Trade-off**: Higher **k** values (e.g., 9) correlate with higher accuracy but longer time-to-answer.
2. **Outlier**: **k=1** (star) has the lowest accuracy (0.635) despite the shortest time-to-answer (8).
3. **Clustering**:
- **k=3** and **k=5** cluster around accuracy ~0.65–0.66.
- **k=9** shows slightly lower accuracy than **k=5** but higher than **k=3**.
4. **Time-to-Answer Spread**:
- **k=1**: 8
- **k=3**: 6–11
- **k=5**: 7–10
- **k=9**: 6–12
---
### Interpretation
The data demonstrates a **positive correlation between k and accuracy**, but with diminishing returns. While increasing **k** improves performance (e.g., k=5 achieves 0.66 accuracy), it also increases computational cost (time-to-answer). The **k=1** outlier suggests that minimal parameterization fails to meet baseline accuracy, highlighting the necessity of sufficient complexity. The **k=9** data point at (12, 0.655) indicates that extreme parameterization may not justify the added time, as its accuracy is only marginally better than **k=5** (0.66). This trade-off is critical for optimizing real-world systems where both accuracy and efficiency matter.