## Chart/Diagram Type: Dual-Axis Evolutionary Analysis
### Overview
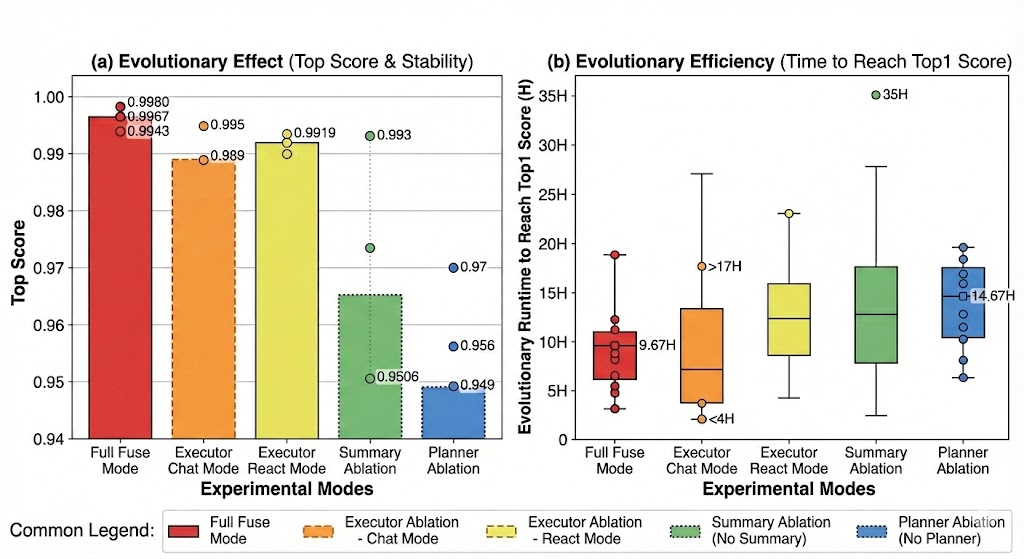
The image contains two side-by-side charts comparing experimental modes across two metrics: (a) **Top Score & Stability** (bar chart) and (b) **Evolutionary Efficiency** (box plot). The charts use color-coded categories to represent different experimental configurations, with numerical values and error bars for precision.
---
### Components/Axes
#### Chart (a): Evolutionary Effect (Top Score & Stability)
- **X-axis**: "Experimental Modes" with categories:
- Full Fuse Mode (red)
- Executor Chat Mode (orange)
- Executor React Mode (yellow)
- Summary Ablation (green)
- Planner Ablation (blue)
- **Y-axis**: "Top Score" (0.94–1.00) with numerical annotations for each bar.
- **Legend**: Located at the bottom, mapping colors to modes.
- **Error Bars**: Dotted lines with numerical values (e.g., 0.9980 for Full Fuse Mode).
#### Chart (b): Evolutionary Efficiency (Time to Reach Top1 Score)
- **X-axis**: Same "Experimental Modes" as chart (a).
- **Y-axis**: "Evolutionary Runtime (H)" (0–35 hours) with box plots showing medians, quartiles, and outliers.
- **Legend**: Same as chart (a), confirming color-to-mode mapping.
- **Outliers**: Marked with dots (e.g., 35H in Planner Ablation).
---
### Detailed Analysis
#### Chart (a): Top Scores
- **Full Fuse Mode**: Highest top score (~0.9980) with minimal error (~0.9943).
- **Executor Chat Mode**: ~0.9880 (error ~0.9895).
- **Executor React Mode**: ~0.9919 (error ~0.9930).
- **Summary Ablation**: ~0.9506 (error ~0.9560).
- **Planner Ablation**: Lowest top score (~0.9490) with error ~0.9550.
#### Chart (b): Evolutionary Runtime
- **Full Fuse Mode**: Median ~5H, range 3–10H.
- **Executor Chat Mode**: Median ~10H, range 4–17H.
- **Executor React Mode**: Median ~12H, range 8–20H.
- **Summary Ablation**: Median ~15H, range 10–25H.
- **Planner Ablation**: Median ~14.67H, range 5–35H (outlier at 35H).
---
### Key Observations
1. **Top Score Trends**:
- Full Fuse Mode dominates with the highest stability (~0.9980).
- Summary Ablation and Planner Ablation show significant drops in top scores (~0.9506 and ~0.9490, respectively).
- Executor React Mode outperforms Chat Mode slightly (~0.9919 vs. ~0.9880).
2. **Efficiency Trends**:
- Full Fuse Mode is the fastest (median ~5H).
- Planner Ablation is the slowest (median ~14.67H, with an outlier at 35H).
- Summary Ablation has the widest runtime distribution (10–25H).
3. **Color Consistency**:
- All chart elements (bars, box plots, error bars) align with the legend’s color-to-mode mapping.
---
### Interpretation
- **Performance vs. Efficiency Trade-off**:
- Full Fuse Mode achieves the highest top score and fastest runtime, suggesting it is the most optimal configuration.
- Ablation modes (Summary and Planner) degrade performance and efficiency, indicating their critical roles in the system.
- **Outlier in Planner Ablation**: The 35H runtime outlier suggests potential instability or edge-case scenarios in this configuration.
- **Ablation Impact**: Removing components (e.g., Summary or Planner) reduces both accuracy and computational efficiency, highlighting their importance.
The data underscores that the Full Fuse Mode balances top performance and efficiency, while ablation strategies compromise both metrics. This aligns with the hypothesis that integrated configurations outperform modular or simplified ones.