# Technical Document Extraction: Roofline Model (Llama 7B, A6000)
## Header
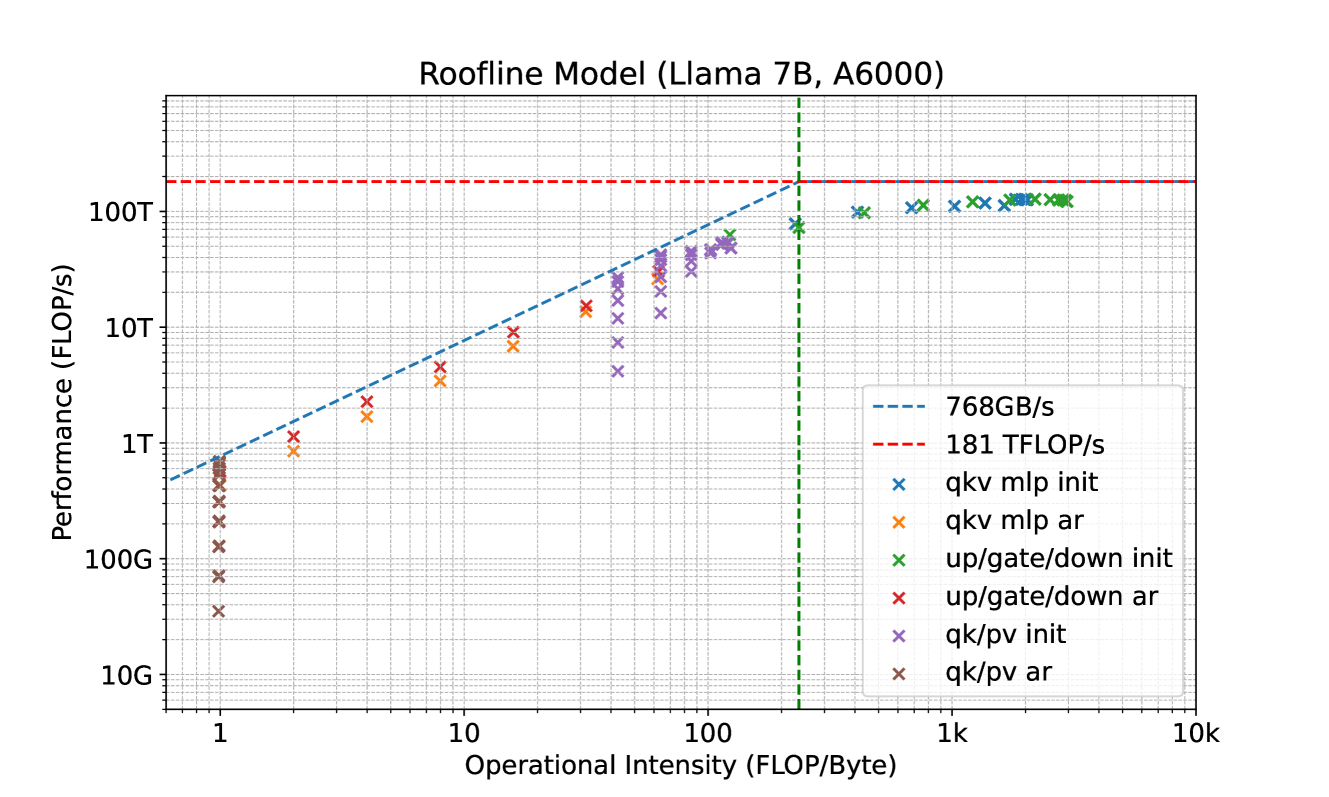
- **Title**: Roofline Model (Llama 7B, A6000)
## Main Chart
### Axes
- **X-axis**: Operational Intensity (FLOP/Byte)
- Range: 1 to 10k (logarithmic scale)
- Key markers:
- Green dashed vertical line at **128 FLOP/Byte**
- **Y-axis**: Performance (FLOP/s)
- Range: 10G to 100T (logarithmic scale)
- Key markers:
- Red dashed horizontal line at **181 TFLOP/s**
- Blue dashed diagonal line from origin to **(128 FLOP/Byte, 181 TFLOP/s)**
### Data Series
#### Legend (Right Side)
| Color | Marker | Label |
|-------|--------|------------------------|
| Blue | X | `qkv mlp init` |
| Orange| X | `qkv mlp ar` |
| Green | X | `up/gate/down init` |
| Red | X | `up/gate/down ar` |
| Purple| X | `qk/pv init` |
| Brown | X | `qk/pv ar` |
#### Visual Trends
1. **Blue Dashed Line** (`768GB/s`):
- Slope: Linear upward from origin to **(128 FLOP/Byte, 181 TFLOP/s)**
- Represents memory bandwidth limit.
2. **Red Dashed Line** (`181 TFLOP/s`):
- Horizontal line at **181 TFLOP/s** (peak performance threshold).
3. **Green Dashed Line** (`128 FLOP/Byte`):
- Vertical line at **128 FLOP/Byte** (operational intensity threshold).
4. **Data Points**:
- All series follow the blue dashed line until **128 FLOP/Byte**, then plateau.
- Example:
- `qkv mlp init` (blue X): Peaks at ~181 TFLOP/s at 128 FLOP/Byte.
- `qk/pv ar` (brown X): Remains below 10T FLOP/s across all intensities.
### Spatial Grounding
- **Legend Position**: Right side of the chart.
- **Color Consistency**:
- Blue X = `qkv mlp init` (matches blue dashed line).
- Orange X = `qkv mlp ar` (distinct from blue).
- Green X = `up/gate/down init` (distinct from red).
## Footer
- **Legend Labels**:
- `qkv mlp init` (blue X)
- `qkv mlp ar` (orange X)
- `up/gate/down init` (green X)
- `up/gate/down ar` (red X)
- `qk/pv init` (purple X)
- `qk/pv ar` (brown X)
## Key Observations
1. **Performance Bottleneck**:
- All workloads hit the **181 TFLOP/s** limit at **128 FLOP/Byte**, indicating memory bandwidth constraints.
2. **Workload Efficiency**:
- `qk/pv ar` (brown X) operates far below the roofline, suggesting inefficiency.
3. **Thresholds**:
- **128 FLOP/Byte** (green line) and **181 TFLOP/s** (red line) define the model's operational limits.