# Technical Document: Pie Chart Analysis
## Chart Type
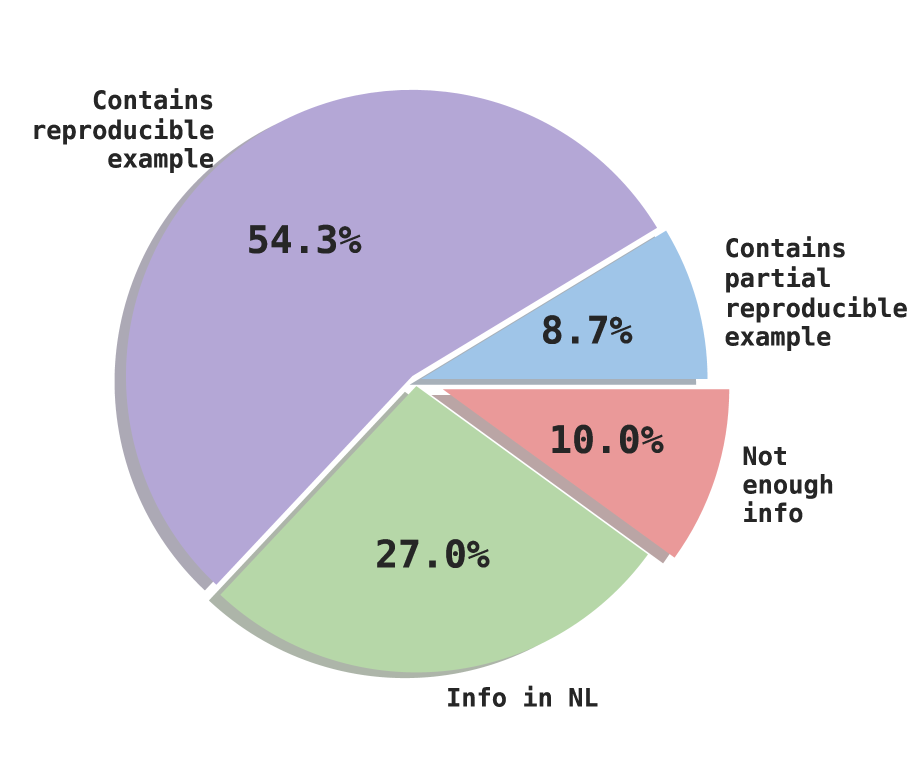
- **Pie Chart** with four distinct segments representing categorical data distribution.
## Labels and Data Points
1. **Contains reproducible example**
- **Percentage**: 54.3%
- **Color**: Purple
- **Position**: Largest segment, occupying more than half of the chart.
2. **Info in NL**
- **Percentage**: 27.0%
- **Color**: Green
- **Position**: Second-largest segment, occupying a quarter of the chart.
3. **Contains partial reproducible example**
- **Percentage**: 8.7%
- **Color**: Blue
- **Position**: Smallest segment, occupying the least space.
4. **Not enough info**
- **Percentage**: 10.0%
- **Color**: Red
- **Position**: Third-largest segment, slightly larger than the blue segment.
## Legend
- **Location**: Left side of the chart.
- **Color-Label Mapping**:
- Purple → Contains reproducible example
- Green → Info in NL
- Blue → Contains partial reproducible example
- Red → Not enough info
## Key Trends
1. **Dominance of Reproducible Examples**:
- Over 54% of the data falls under "Contains reproducible example," indicating a strong emphasis on reproducibility.
2. **Significant Non-Reproducible Data**:
- Combined, "Contains partial reproducible example" (8.7%) and "Not enough info" (10.0%) account for 18.7% of the data, highlighting gaps in reproducibility.
3. **Language-Specific Data**:
- "Info in NL" (27.0%) suggests a notable portion of the data is tied to Dutch-language information.
## Structural Notes
- **Total Percentage**: 54.3% + 27.0% + 8.7% + 10.0% = 100% (validates completeness).
- **Segment Order**: Segments are arranged clockwise, starting with the largest (purple) and ending with the smallest (blue).
## Conclusion
The chart illustrates a distribution where reproducibility is the primary focus, with a substantial portion of data lacking sufficient information or only partially meeting reproducibility criteria. The inclusion of language-specific data ("Info in NL") adds a layer of contextual relevance.