# Technical Data Extraction: Reproducibility Analysis Pie Chart
## 1. Image Overview
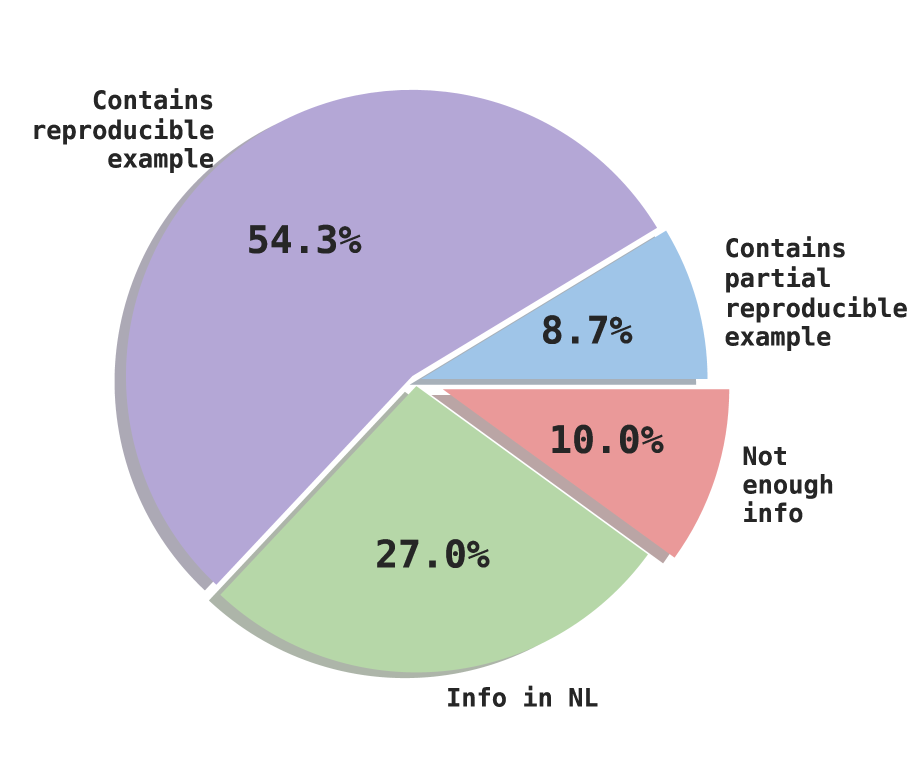
The image is a 3D-styled exploded pie chart illustrating the distribution of four categories related to the presence of reproducible examples or information in a dataset. The chart uses a pastel color palette with drop shadows for a three-dimensional effect.
## 2. Data Table Extraction
The following table reconstructs the data presented in the chart, mapping the visual labels to their corresponding percentage values and colors.
| Category | Percentage | Color | Visual Position |
| :--- | :--- | :--- | :--- |
| **Contains reproducible example** | 54.3% | Light Purple | Top-Left to Top-Right |
| **Info in NL** | 27.0% | Light Green | Bottom |
| **Not enough info** | 10.0% | Light Red/Pink | Bottom-Right (Exploded) |
| **Contains partial reproducible example** | 8.7% | Light Blue | Middle-Right (Exploded) |
## 3. Component Analysis & Spatial Grounding
### Main Chart Area
* **Total Value:** The sum of the visible percentages is 100.0% (54.3 + 27.0 + 10.0 + 8.7).
* **Dominant Category:** "Contains reproducible example" is the largest segment, accounting for more than half of the chart (54.3%).
* **Exploded Slices:** Two segments are physically separated from the main center of the pie to provide visual emphasis:
* **Contains partial reproducible example (8.7%)**
* **Not enough info (10.0%)**
### Labels and Text
* **Font Style:** The text uses a monospaced, typewriter-style font.
* **Placement:** Labels are placed outside the circumference of the pie chart, while the percentage values are placed inside the respective colored segments.
* **Transcription of Labels:**
* "Contains reproducible example"
* "Contains partial reproducible example"
* "Not enough info"
* "Info in NL" (Note: "NL" typically refers to Natural Language in technical contexts).
## 4. Trend and Distribution Summary
The data indicates a majority of the analyzed items (54.3%) contain a full reproducible example. When combined with the "partial" category (8.7%), a total of 63% of the dataset contains some form of reproducible code or example. The remaining 37% is split between items containing information only in Natural Language (27.0%) and items with insufficient information (10.0%).