## Line Chart: Model Performance Score
### Overview
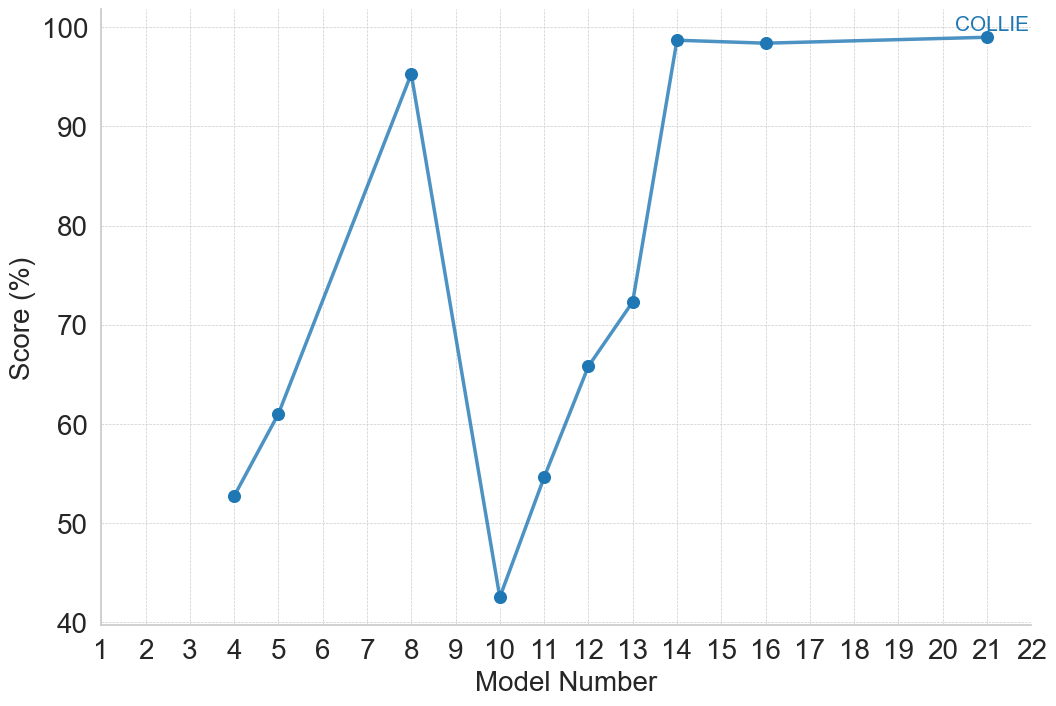
The image is a line chart displaying the performance score (in percentage) of different models, numbered from 1 to 22. The chart shows the trend of the "COLLIE" model's score across these model numbers.
### Components/Axes
* **X-axis:** "Model Number" ranging from 1 to 22, with tick marks at each integer value.
* **Y-axis:** "Score (%)" ranging from 40 to 100, with tick marks at intervals of 10.
* **Legend:** Located at the top-right corner, the label "COLLIE" is associated with the blue line.
### Detailed Analysis
The chart contains one data series, "COLLIE," represented by a blue line.
* **Trend:** The "COLLIE" line exhibits significant fluctuations in the early model numbers, followed by a sharp increase and then plateaus at a high score.
* **Data Points:**
* Model 4: Score approximately 53%
* Model 5: Score approximately 61%
* Model 8: Score approximately 95%
* Model 10: Score approximately 42%
* Model 11: Score approximately 55%
* Model 12: Score approximately 66%
* Model 13: Score approximately 72%
* Model 14: Score approximately 98%
* Model 16: Score approximately 98%
* Model 21: Score approximately 99%
### Key Observations
* The "COLLIE" model's performance varies significantly between model numbers 4 and 13.
* The model achieves a high and stable performance score from model number 14 onwards.
* There is a notable dip in performance at model number 10.
### Interpretation
The chart suggests that the "COLLIE" model underwent several iterations or modifications, resulting in fluctuating performance scores. The significant improvement observed after model number 13 indicates a successful optimization or refinement of the model. The stable high score from model number 14 onwards implies that the model has reached a satisfactory level of performance. The dip at model 10 could indicate a problematic change that was later corrected.