\n
## Line Chart: Model Score Performance
### Overview
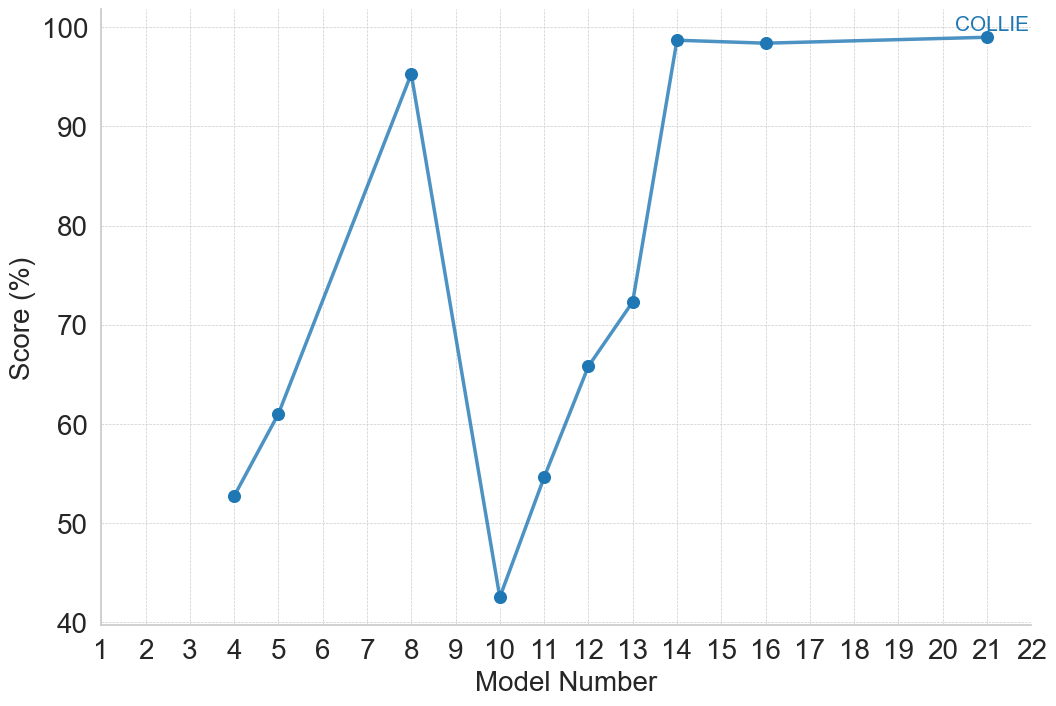
This image presents a line chart illustrating the performance score of a model (labeled "COLLIE") across a range of model numbers, from 1 to 22. The y-axis represents the score in percentage, while the x-axis represents the model number. The chart shows how the score changes as the model number increases.
### Components/Axes
* **X-axis:** "Model Number" ranging from 1 to 22, with tick marks at each integer value.
* **Y-axis:** "Score (%)" ranging from 40 to 100, with tick marks at intervals of 10.
* **Data Series:** A single line representing "COLLIE" performance.
* **Legend:** Located in the top-right corner, labeling the line as "COLLIE" and using a light blue color.
* **Gridlines:** A light gray grid is present to aid in reading values.
### Detailed Analysis
The line representing "COLLIE" exhibits a non-linear trend.
* **Model 1:** Approximately 52%
* **Model 2:** Approximately 52%
* **Model 3:** Approximately 54%
* **Model 4:** Approximately 55%
* **Model 5:** Approximately 62%
* **Model 6:** Approximately 62%
* **Model 7:** Approximately 72%
* **Model 8:** Approximately 94%
* **Model 9:** Approximately 95%
* **Model 10:** Approximately 42%
* **Model 11:** Approximately 55%
* **Model 12:** Approximately 73%
* **Model 13:** Approximately 75%
* **Model 14:** Approximately 98%
* **Model 15:** Approximately 98%
* **Model 16:** Approximately 97%
* **Model 17:** Approximately 97%
* **Model 18:** Approximately 97%
* **Model 19:** Approximately 97%
* **Model 20:** Approximately 98%
* **Model 21:** Approximately 98%
* **Model 22:** Approximately 98%
The line initially shows a slow, gradual increase from Model 1 to Model 7. There is a sharp increase between Model 7 and Model 9, reaching a peak around 95%. A dramatic drop occurs between Model 9 and Model 10, falling to approximately 42%. The line then rises again, reaching another peak around 98% between Models 14 and 22, where it plateaus.
### Key Observations
* **Peak Performance:** The model achieves its highest score (approximately 98%) between Model 14 and Model 22.
* **Significant Drop:** A substantial decrease in score is observed between Model 9 and Model 10.
* **Initial Improvement:** The model shows a steady improvement in score from Model 1 to Model 7.
* **Plateau:** The score remains relatively constant from Model 14 to Model 22.
### Interpretation
The data suggests that the "COLLIE" model undergoes significant performance fluctuations as the model number changes. The initial improvement indicates a learning or optimization phase. The sharp drop between Model 9 and Model 10 could be due to a change in training data, a hyperparameter adjustment, or an error in the model building process. The subsequent rise and plateau suggest that the model has converged to a stable, high-performing state. The consistent high scores from Model 14 onwards indicate that further increases in the model number do not lead to substantial improvements in performance. This could be a point of diminishing returns, where additional model complexity or training does not yield significant benefits. The initial slow increase could represent a period of initial learning, while the later plateau suggests the model has reached its maximum potential within the given parameters.