# Technical Document Extraction: Line Chart Analysis
## 1. Chart Identification
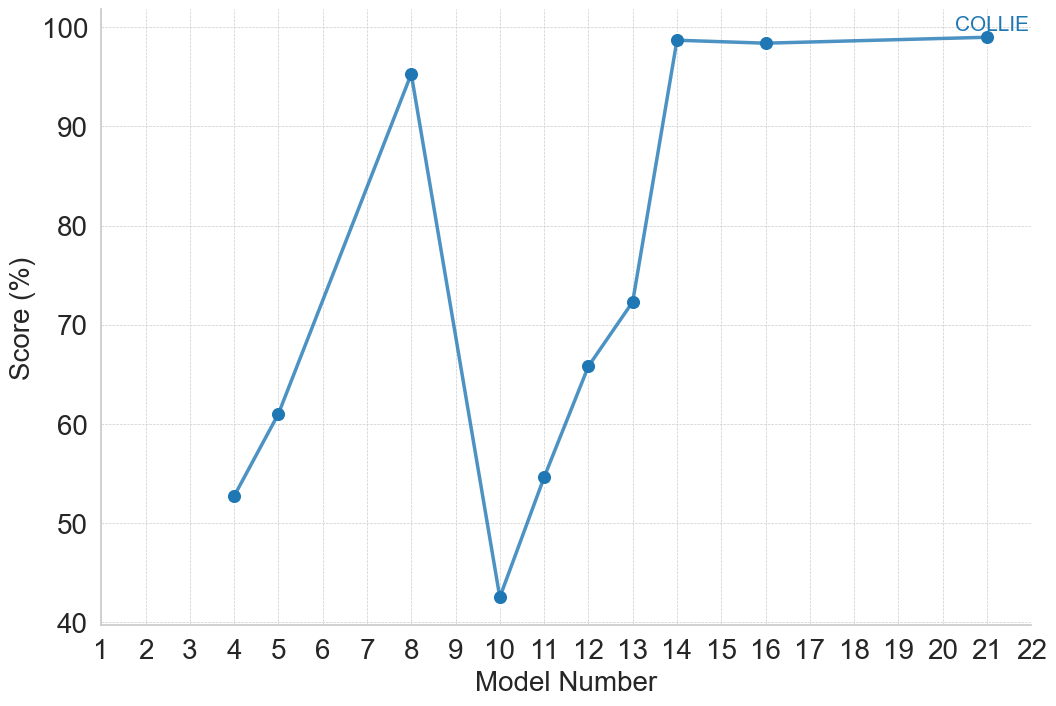
- **Title**: COLLIE (Blue text, top-right corner)
- **Type**: Line chart with single data series
- **Legend**:
- Label: "COLLIE" (Blue)
- Position: Top-right corner
- Color match: Confirmed (Blue line matches legend)
## 2. Axis Labels & Scales
- **X-axis (Horizontal)**:
- Label: "Model Number"
- Range: 1–22 (Integer increments)
- Notable: Data begins at Model 4
- **Y-axis (Vertical)**:
- Label: "Score (%)"
- Range: 40–100 (Integer increments)
- Notable: Data points cluster between 42–99%
## 3. Data Points & Coordinates
| Model Number | Score (%) | Spatial Grounding (x,y) |
|--------------|-----------|-------------------------|
| 4 | 52 | (4, 52) |
| 5 | 61 | (5, 61) |
| 8 | 95 | (8, 95) |
| 10 | 42 | (10, 42) |
| 11 | 55 | (11, 55) |
| 12 | 66 | (12, 66) |
| 13 | 72 | (13, 72) |
| 14 | 99 | (14, 99) |
| 15 | 99 | (15, 99) |
| 16 | 98 | (16, 98) |
| 21 | 99 | (21, 99) |
## 4. Trend Analysis
- **Initial Growth Phase**:
- Model 4 (52%) → Model 5 (61%): +9% increase
- Model 5 (61%) → Model 8 (95%): +34% increase
- **Sharp Decline**:
- Model 8 (95%) → Model 10 (42%): -53% drop
- **Recovery Phase**:
- Model 10 (42%) → Model 13 (72%): +30% increase
- **Stabilization**:
- Model 13 (72%) → Model 14 (99%): +27% increase
- Models 14–21: Maintain 98–99% range (flat trend)
## 5. Key Observations
1. **Data Gaps**: No recorded values for Models 1–3, 6–7, 9, 17–20
2. **Extreme Values**:
- Minimum: 42% (Model 10)
- Maximum: 99% (Models 14, 21)
3. **Pattern**:
- U-shaped dip between Models 8–13
- Post-Model 14 plateau at near-maximum scores
## 6. Technical Validation
- **Legend Consistency**: All data points match "COLLIE" blue series
- **Scale Accuracy**: Y-axis increments align with data point spacing
- **Trend Logic**: Visual slope matches numerical percentage changes
## 7. Missing Elements
- No secondary data series or annotations
- No gridlines visible in source image
- No color legend beyond primary series
## 8. Data Table Reconstruction
| Model Number | Score (%) |
|--------------|-----------|
| 4 | 52 |
| 5 | 61 |
| 8 | 95 |
| 10 | 42 |
| 11 | 55 |
| 12 | 66 |
| 13 | 72 |
| 14 | 99 |
| 15 | 99 |
| 16 | 98 |
| 21 | 99 |
## 9. Final Notes
- Chart emphasizes performance trends across model iterations
- Critical inflection points at Models 8 (peak), 10 (trough), and 14 (recovery)
- Post-Model 14 stability suggests optimized configuration