## Diagram: Processor Task Flow
### Overview
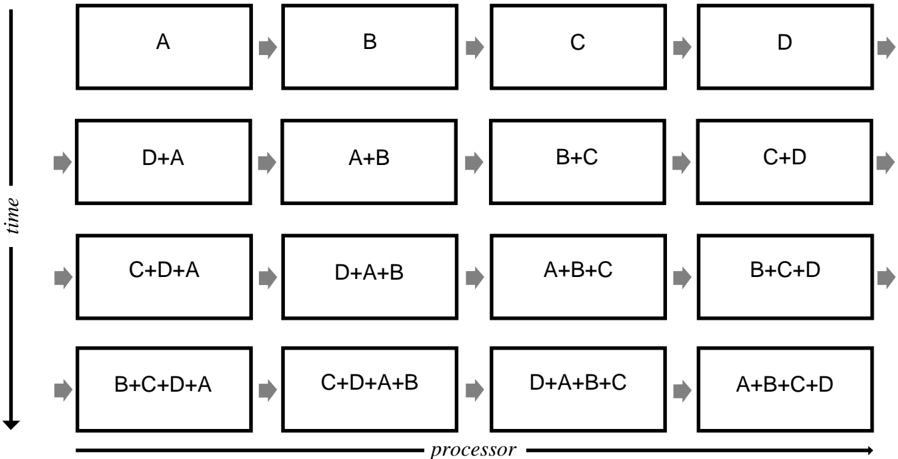
The image is a diagram illustrating the flow of tasks across processors over time. It depicts a sequence of operations, where individual tasks (A, B, C, D) are combined and processed sequentially. The diagram is organized in a grid format, with the horizontal axis representing the processor and the vertical axis representing time. Each cell in the grid represents a processing stage, showing the combination of tasks being processed at that stage.
### Components/Axes
* **Horizontal Axis:** Labeled "processor," indicating the progression of tasks across different processing units.
* **Vertical Axis:** Labeled "time," indicating the temporal sequence of the tasks. The arrow points downwards, indicating the direction of time.
* **Rectangular Boxes:** Each box represents a processing stage, containing the tasks being processed at that stage.
* **Arrows:** Gray arrows indicate the flow of tasks from one processing stage to the next.
### Detailed Analysis
The diagram consists of a 4x4 grid of rectangular boxes, each containing a combination of tasks (A, B, C, D). The tasks are processed sequentially, with the output of one stage becoming the input of the next.
**Row 1 (Top Row):**
* Box 1: A
* Box 2: B
* Box 3: C
* Box 4: D
**Row 2:**
* Box 1: D+A
* Box 2: A+B
* Box 3: B+C
* Box 4: C+D
**Row 3:**
* Box 1: C+D+A
* Box 2: D+A+B
* Box 3: A+B+C
* Box 4: B+C+D
**Row 4 (Bottom Row):**
* Box 1: B+C+D+A
* Box 2: C+D+A+B
* Box 3: D+A+B+C
* Box 4: A+B+C+D
The arrows indicate the flow of tasks from left to right (across processors) and from top to bottom (over time).
### Key Observations
* The tasks are combined sequentially, with each stage adding a new task to the combination.
* The order of tasks in each combination appears to be consistent within each row.
* The diagram illustrates a pipeline processing model, where tasks are processed in parallel across multiple processors.
### Interpretation
The diagram illustrates a pipeline processing model where tasks A, B, C, and D are processed sequentially across multiple processors. The "processor" axis represents the progression of tasks through different processing units, while the "time" axis represents the temporal sequence of the tasks. Each box represents a processing stage, where the tasks are combined and processed. The diagram demonstrates how tasks can be processed in parallel to improve overall throughput. The sequential combination of tasks suggests a dependency relationship, where each task relies on the output of the previous stage. The diagram could represent a simplified model of a complex processing system, such as a compiler or a data processing pipeline.