\n
## Diagram: Iterative Processing Flow
### Overview
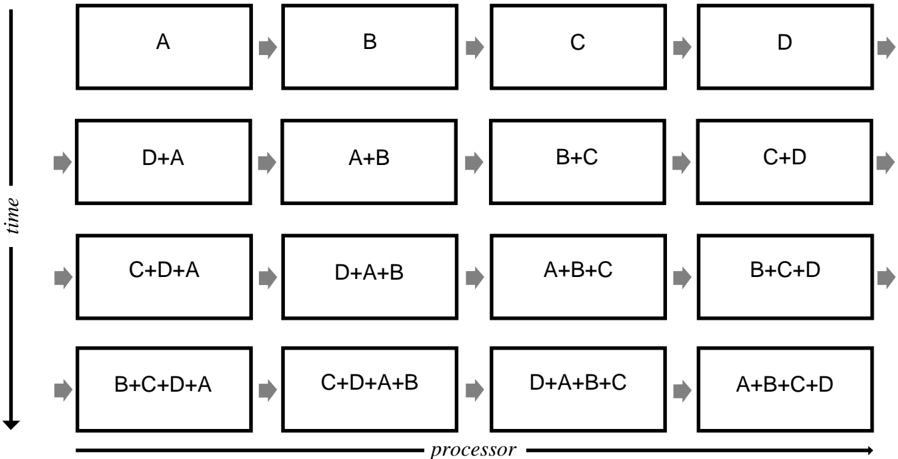
This diagram illustrates an iterative process involving four elements (A, B, C, and D) processed sequentially over time. Each step combines the current element with the results of previous steps, demonstrating a cumulative effect. The diagram is organized in a grid format, with 'time' progressing vertically and 'processor' horizontally.
### Components/Axes
* **Axes:**
* Vertical Axis: Labeled "time", with arrows indicating progression downwards.
* Horizontal Axis: Labeled "processor", with arrows indicating progression to the right.
* **Elements:** A, B, C, D
* **Process:** Each box represents a processing step, showing the combination of elements.
### Detailed Analysis or Content Details
The diagram consists of four rows (representing time steps) and four columns (representing processor steps). The content of each box represents the elements being processed at that step.
* **Row 1 (Time Step 1):**
* Box 1: A
* Box 2: B
* Box 3: C
* Box 4: D
* **Row 2 (Time Step 2):**
* Box 1: D+A
* Box 2: A+B
* Box 3: B+C
* Box 4: C+D
* **Row 3 (Time Step 3):**
* Box 1: C+D+A
* Box 2: D+A+B
* Box 3: A+B+C
* Box 4: B+C+D
* **Row 4 (Time Step 4):**
* Box 1: B+C+D+A
* Box 2: C+D+A+B
* Box 3: D+A+B+C
* Box 4: A+B+C+D
The arrows between the boxes indicate the flow of processing from one step to the next. The order of elements in the sums appears to follow the order of the processor steps.
### Key Observations
* The process is iterative, with each step building upon the results of the previous steps.
* The complexity of the expression increases with each time step, adding one element at a time.
* The order of elements in the sums is consistent with the processor order.
* The diagram demonstrates a cyclical or cumulative process.
### Interpretation
This diagram likely represents a computational or algorithmic process where elements A, B, C, and D are combined iteratively. The diagram could illustrate:
* **Data Fusion:** Combining different data sources (A, B, C, D) over time to create a more comprehensive result.
* **Error Correction:** Accumulating corrections (A, B, C, D) to refine an initial estimate.
* **Signal Processing:** Combining signals (A, B, C, D) to enhance a desired signal or filter out noise.
* **Parallel Processing:** The horizontal axis could represent different processors working on the same data in a pipelined fashion.
The diagram's simplicity suggests a fundamental concept, and the iterative nature implies a process that continues beyond the four time steps shown. The consistent order of elements in the sums suggests a deterministic algorithm. The diagram does not provide specific values or units, so the exact nature of the process remains open to interpretation.