\n
## Diagram: Parallel Pipeline Processing Over Time and Processors
### Overview
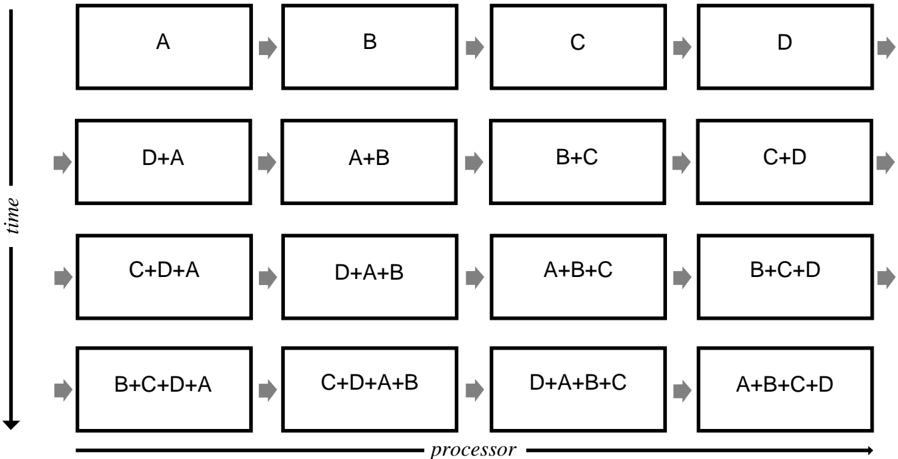
The image is a technical diagram illustrating a parallel processing pipeline. It shows how tasks or data elements (labeled A, B, C, D) are processed across multiple processors over sequential time steps. The diagram is structured as a 4x4 grid, with time progressing vertically downward and processors arranged horizontally. Arrows indicate the flow of data or control between processing stages.
### Components/Axes
* **Vertical Axis (Left Side):** Labeled "time" with a downward-pointing arrow, indicating that time progresses from the top row to the bottom row.
* **Horizontal Axis (Bottom):** Labeled "processor" with a rightward-pointing arrow, indicating that processors are arranged from left to right.
* **Grid Structure:** The diagram consists of four rows (time steps) and four columns (processors). Each cell contains a rectangular box representing a processing stage.
* **Flow Arrows:** Gray arrows connect the boxes. Arrows point rightward within each row (indicating data flow between processors at the same time step) and downward between rows (indicating the progression of a task to the next time step on the same or a different processor).
### Detailed Analysis
The content of each processing stage (box) is a combination of the letters A, B, C, and D, representing tasks, data packets, or pipeline stages. The combinations become more complex as time progresses.
**Row 1 (Time Step 1):**
* Processor 1: `A`
* Processor 2: `B`
* Processor 3: `C`
* Processor 4: `D`
* *Trend:* Each processor handles a single, distinct initial task.
**Row 2 (Time Step 2):**
* Processor 1: `D+A`
* Processor 2: `A+B`
* Processor 3: `B+C`
* Processor 4: `C+D`
* *Trend:* Each processor now handles a combination of two tasks. The pattern suggests a circular dependency or a ring topology where the last element (D) wraps around to combine with the first (A).
**Row 3 (Time Step 3):**
* Processor 1: `C+D+A`
* Processor 2: `D+A+B`
* Processor 3: `A+B+C`
* Processor 4: `B+C+D`
* *Trend:* Each processor handles a combination of three tasks, continuing the circular accumulation pattern.
**Row 4 (Time Step 4):**
* Processor 1: `B+C+D+A`
* Processor 2: `C+D+A+B`
* Processor 3: `D+A+B+C`
* Processor 4: `A+B+C+D`
* *Trend:* Each processor handles a combination of all four tasks. The final state shows each processor has cycled through and accumulated all elements, but starting from a different point in the sequence (A, B, C, D respectively).
### Key Observations
1. **Pipeline Fill and Propagation:** The diagram visualizes a pipeline being filled. Initially, tasks are isolated. In subsequent steps, results from previous stages (or neighboring processors) are combined with new tasks.
2. **Circular/Ring Pattern:** The combination logic follows a strict circular pattern. For any processor at time `T`, its task combination appears to be the combination from the processor to its left at time `T-1`, plus its own original task from time `T=1`. This creates a wave of data propagating around the processor ring.
3. **Symmetry and Regularity:** The pattern is perfectly symmetric and deterministic. Every processor follows the same rule, leading to a predictable state at each time step.
4. **Final State Convergence:** By the fourth time step, every processor contains all four elements (A, B, C, D), albeit in a different cyclic order. This suggests the pipeline has reached a steady state where all processors have full visibility of the entire dataset or task set.
### Interpretation
This diagram is a classic representation of a **circular pipeline** or **ring algorithm** in parallel computing. It demonstrates how a set of data elements can be propagated through a network of processors so that, after a number of steps equal to the number of processors, every processor has possessed every element.
* **What it demonstrates:** It shows an efficient method for broadcasting or reducing data in a parallel system with a ring interconnect. Each processor performs a local computation (the combination, which could be an addition, merge, or other operation) and passes a result to its neighbor.
* **How elements relate:** The "processor" axis defines the physical or logical network topology (a ring). The "time" axis shows the sequential steps of the algorithm. The content of each box is the state of that processor at that time.
* **Notable Pattern:** The key insight is the **lag and accumulation**. Processor 1 at Time 2 (`D+A`) has received `D` from Processor 4 (from Time 1) and combined it with its own `A`. This pattern cascades, illustrating both communication (passing data rightward/downward) and computation (the `+` operation).
* **Purpose:** Such a pattern is fundamental in parallel algorithms for operations like prefix sums, matrix multiplication in a systolic array, or any computation where data needs to be shared across all nodes in a structured, communication-efficient manner. The diagram elegantly captures the deterministic flow and state evolution of such an algorithm.