## Violin Plot: Elementary Math
### Overview
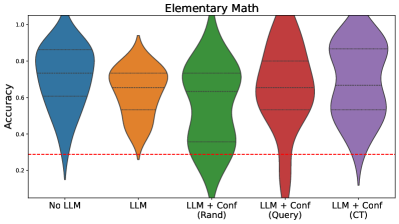
The image is a violin plot comparing the accuracy of different models on elementary math problems. The models include a baseline with no Large Language Model (LLM), an LLM alone, and LLMs with confidence measures using random selection (Rand), query-based selection (Query), and a context-tracking method (CT). The plot shows the distribution of accuracy scores for each model. A red dashed line is present at y=0.3.
### Components/Axes
* **Title:** Elementary Math
* **Y-axis:** Accuracy, ranging from 0.2 to 1.0 in increments of 0.2.
* **X-axis:** Categorical labels representing different models:
* No LLM (Blue)
* LLM (Orange)
* LLM + Conf (Rand) (Green)
* LLM + Conf (Query) (Red)
* LLM + Conf (CT) (Purple)
* **Horizontal dashed lines:** Present within each violin plot at approximately y=0.75, y=0.6, and y=0.3.
* **Horizontal dashed red line:** Present at y=0.3.
### Detailed Analysis
* **No LLM (Blue):** The violin plot is broad, indicating a wide range of accuracy scores. The distribution appears to be skewed towards higher accuracy, with the bulk of the data above 0.6. The minimum accuracy is approximately 0.15, and the maximum is approximately 1.0.
* **LLM (Orange):** The violin plot is narrower than "No LLM," suggesting a smaller range of accuracy scores. The distribution is centered around 0.7, with a minimum accuracy of approximately 0.27 and a maximum of approximately 0.95.
* **LLM + Conf (Rand) (Green):** The violin plot is similar in width to "No LLM" but appears to have a more concentrated distribution around 0.7. The minimum accuracy is approximately 0.08, and the maximum is approximately 1.0.
* **LLM + Conf (Query) (Red):** This violin plot is the narrowest, indicating the most consistent accuracy scores. The distribution is centered around 0.7, with a minimum accuracy of approximately 0.05 and a maximum of approximately 1.0.
* **LLM + Conf (CT) (Purple):** The violin plot is wider than "LLM + Conf (Query)" but narrower than "No LLM." The distribution is centered around 0.7, with a minimum accuracy of approximately 0.25 and a maximum of approximately 1.0.
### Key Observations
* All models using an LLM, with or without confidence measures, generally perform better than the baseline "No LLM" model.
* The "LLM + Conf (Query)" model appears to have the most consistent performance, as indicated by the narrowest violin plot.
* The "No LLM" model has the widest distribution of accuracy scores, suggesting the least consistent performance.
* The red dashed line at y=0.3 serves as a visual reference point, highlighting the proportion of scores above this threshold for each model.
### Interpretation
The data suggests that incorporating an LLM significantly improves accuracy on elementary math problems. Furthermore, using confidence measures, especially with query-based selection, can lead to more consistent performance. The "No LLM" model's wide distribution indicates that its accuracy is highly variable, while the "LLM + Conf (Query)" model's narrow distribution suggests a more reliable and predictable performance. The red line at 0.3 could represent a minimum acceptable accuracy level, and the plot shows how each model performs relative to this threshold.