## Violin Plot: Elementary Math Accuracy Comparison
### Overview
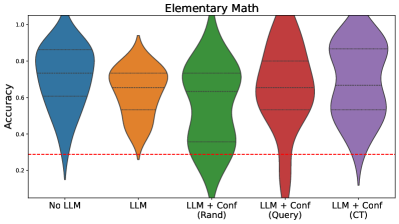
The image displays a violin plot comparing the accuracy distributions of five different model configurations in elementary math tasks. The plot uses color-coded distributions to visualize performance variations across model architectures and confidence mechanisms.
### Components/Axes
- **X-axis (Categories)**:
- No LLM (blue)
- LLM (orange)
- LLM + Conf (Rand) (green)
- LLM + Conf (Query) (red)
- LLM + Conf (CT) (purple)
- **Y-axis (Accuracy)**: Ranges from 0.0 to 1.0 with horizontal gridlines at 0.2, 0.4, 0.6, 0.8
- **Reference Line**: Red dashed line at y=0.3
- **Color Legend**: Directly mapped to x-axis categories (no separate legend box)
### Detailed Analysis
1. **No LLM (Blue)**:
- Distribution peaks between 0.7-0.8
- Narrowest distribution with minimal spread
- Median accuracy ~0.75
2. **LLM (Orange)**:
- Bimodal distribution with peaks at ~0.5 and ~0.6
- Wider spread than No LLM
- Median accuracy ~0.55
3. **LLM + Conf (Rand) (Green)**:
- Single peak at ~0.6
- Moderate spread with slight dip at 0.4-0.5
- Median accuracy ~0.6
4. **LLM + Conf (Query) (Red)**:
- Double-peaked distribution at ~0.6 and ~0.7
- Significant spread between 0.4-0.8
- Median accuracy ~0.65
5. **LLM + Conf (CT) (Purple)**:
- Tallest peak at ~0.75
- Narrowest distribution among confidence-enhanced models
- Median accuracy ~0.78
### Key Observations
- All models exceed the 0.3 accuracy threshold (red dashed line)
- LLM + Conf (CT) shows highest median accuracy (0.78) and tightest distribution
- No LLM and LLM + Conf (Rand) have the lowest variability
- LLM + Conf (Query) demonstrates the widest performance spread
- Confidence mechanisms generally improve performance over base LLM
### Interpretation
The data suggests that confidence-enhanced models (particularly CT) achieve superior accuracy in elementary math tasks compared to base LLM configurations. The CT method appears most effective at maintaining high accuracy with minimal performance variance. The red threshold line indicates a performance floor, with all models demonstrating capability above this level. The widening distributions in confidence-enhanced models suggest increased computational complexity or parameter tuning requirements. Notably, the Query confidence method shows significant performance variability, potentially indicating sensitivity to input formatting or question complexity.