\n
## Bar Chart: Execution Time vs. Goroutines with Varying Core Counts
### Overview
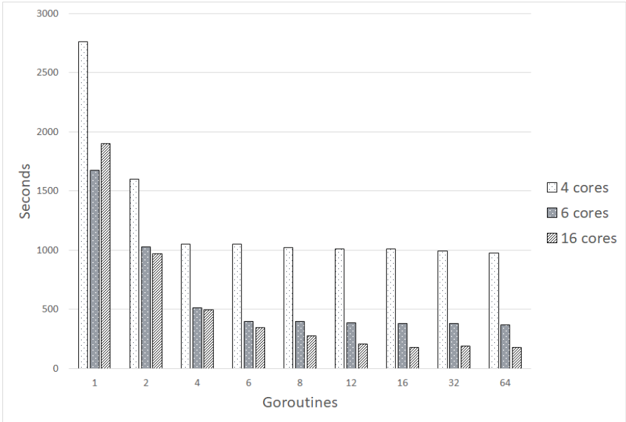
This bar chart depicts the relationship between the number of goroutines and the execution time (in seconds) for different core counts (4, 6, and 16). The chart aims to illustrate how performance scales with increasing goroutines and core availability.
### Components/Axes
* **X-axis:** "Goroutines" - Represents the number of concurrent goroutines, with markers at 1, 2, 4, 6, 8, 12, 16, 32, and 64.
* **Y-axis:** "Seconds" - Represents the execution time in seconds, ranging from 0 to approximately 3000.
* **Legend:** Located in the top-right corner, identifies the three data series:
* "4 cores" (Light Gray)
* "6 cores" (Medium Gray)
* "16 cores" (Dark Gray)
### Detailed Analysis
The chart consists of nine bars for each core count, representing the execution time for each number of goroutines.
**4 Cores (Light Gray):**
* 1 Goroutine: Approximately 2750 seconds.
* 2 Goroutines: Approximately 1800 seconds.
* 4 Goroutines: Approximately 1000 seconds.
* 6 Goroutines: Approximately 600 seconds.
* 8 Goroutines: Approximately 400 seconds.
* 12 Goroutines: Approximately 300 seconds.
* 16 Goroutines: Approximately 200 seconds.
* 32 Goroutines: Approximately 250 seconds.
* 64 Goroutines: Approximately 200 seconds.
**6 Cores (Medium Gray):**
* 1 Goroutine: Approximately 1700 seconds.
* 2 Goroutines: Approximately 950 seconds.
* 4 Goroutines: Approximately 600 seconds.
* 6 Goroutines: Approximately 400 seconds.
* 8 Goroutines: Approximately 300 seconds.
* 12 Goroutines: Approximately 250 seconds.
* 16 Goroutines: Approximately 200 seconds.
* 32 Goroutines: Approximately 200 seconds.
* 64 Goroutines: Approximately 150 seconds.
**16 Cores (Dark Gray):**
* 1 Goroutine: Approximately 1000 seconds.
* 2 Goroutines: Approximately 500 seconds.
* 4 Goroutines: Approximately 300 seconds.
* 6 Goroutines: Approximately 200 seconds.
* 8 Goroutines: Approximately 150 seconds.
* 12 Goroutines: Approximately 120 seconds.
* 16 Goroutines: Approximately 100 seconds.
* 32 Goroutines: Approximately 100 seconds.
* 64 Goroutines: Approximately 100 seconds.
**Trends:**
* For all core counts, the execution time generally decreases as the number of goroutines increases up to a certain point.
* The 4-core series shows a significant decrease in execution time from 1 to 4 goroutines, then plateaus and even increases slightly at 32 goroutines.
* The 6-core series exhibits a similar trend to the 4-core series, but with lower execution times overall.
* The 16-core series shows the most consistent decrease in execution time with increasing goroutines, leveling off at 16, 32, and 64 goroutines.
### Key Observations
* Increasing the number of cores consistently reduces execution time.
* There appears to be an optimal number of goroutines for each core count. Beyond this point, adding more goroutines does not significantly improve performance and can even degrade it (especially noticeable with 4 cores).
* The 16-core system demonstrates the best scalability, maintaining relatively low execution times across all goroutine counts.
* The 4-core system shows the most pronounced performance degradation beyond a certain number of goroutines, suggesting contention or overhead becomes significant.
### Interpretation
The data suggests that utilizing goroutines can improve performance, but the benefits are heavily dependent on the number of available cores. A system with more cores can effectively handle a larger number of concurrent goroutines without significant overhead. The observed plateau and even increase in execution time with higher goroutine counts on the 4-core system likely indicates that the overhead of context switching and synchronization outweighs the benefits of parallelism.
The chart demonstrates the importance of balancing concurrency (goroutines) with available resources (cores) to achieve optimal performance. The 16-core system's consistent performance suggests it is well-equipped to handle a high degree of concurrency, while the 4-core system is more limited. This data could be used to inform decisions about resource allocation and application design to maximize efficiency. The leveling off of the 16 core system at 16 goroutines suggests that the application itself may be the limiting factor, rather than the number of cores.