## Bar Chart: Execution Time by Goroutines and Core Counts
### Overview
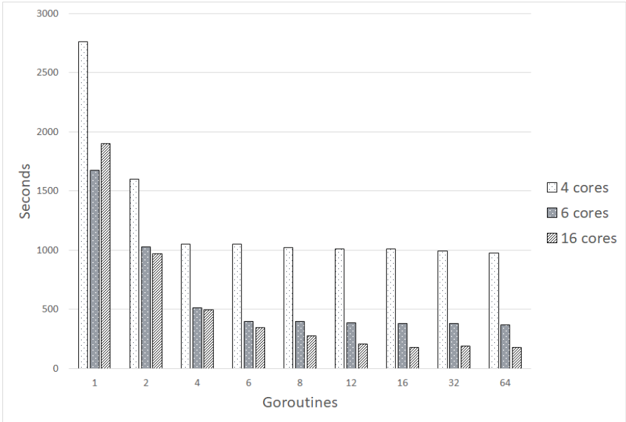
The chart compares execution time (in seconds) across different numbers of Goroutines (1, 2, 4, 6, 8, 12, 16, 32, 64) for three core configurations: 4 cores (white), 6 cores (gray), and 16 cores (black). Execution time decreases as Goroutines increase, with 16 cores consistently outperforming 4 and 6 cores.
### Components/Axes
- **X-axis (Goroutines)**: Labeled "Goroutines" with values: 1, 2, 4, 6, 8, 12, 16, 32, 64.
- **Y-axis (Seconds)**: Labeled "Seconds" with a range from 0 to 3000.
- **Legend**: Located on the right, with three entries:
- 4 cores (white)
- 6 cores (gray)
- 16 cores (black)
### Detailed Analysis
- **Goroutine 1**:
- 4 cores: ~2800 seconds
- 6 cores: ~1700 seconds
- 16 cores: ~1900 seconds
- **Goroutine 2**:
- 4 cores: ~1600 seconds
- 6 cores: ~1000 seconds
- 16 cores: ~950 seconds
- **Goroutine 4**:
- 4 cores: ~1050 seconds
- 6 cores: ~500 seconds
- 16 cores: ~480 seconds
- **Goroutine 6**:
- 4 cores: ~1020 seconds
- 6 cores: ~380 seconds
- 16 cores: ~320 seconds
- **Goroutine 8**:
- 4 cores: ~1010 seconds
- 6 cores: ~370 seconds
- 16 cores: ~280 seconds
- **Goroutine 12**:
- 4 cores: ~1005 seconds
- 6 cores: ~360 seconds
- 16 cores: ~240 seconds
- **Goroutine 16**:
- 4 cores: ~1000 seconds
- 6 cores: ~350 seconds
- 16 cores: ~220 seconds
- **Goroutine 32**:
- 4 cores: ~990 seconds
- 6 cores: ~340 seconds
- 16 cores: ~210 seconds
- **Goroutine 64**:
- 4 cores: ~980 seconds
- 6 cores: ~330 seconds
- 16 cores: ~200 seconds
### Key Observations
1. **Inverse Relationship**: Execution time decreases as Goroutines increase for all core configurations.
2. **Core Count Impact**: 16 cores reduce execution time by ~50% compared to 4 cores at Goroutine 1, and by ~60% at Goroutine 64.
3. **Diminishing Returns**: The performance gap between core configurations narrows at higher Goroutine counts (e.g., 4 vs. 16 cores at Goroutine 64: 980 vs. 200 seconds).
### Interpretation
The data demonstrates that increasing both Goroutines and core count improves scalability and reduces execution time. The 16-core configuration achieves near-linear speedup with Goroutine growth, suggesting efficient parallelization. The 4-core configuration shows the highest latency, likely due to resource contention. This chart highlights the importance of core allocation in optimizing concurrent workloads, with 16 cores providing the most significant performance gains across all tested scenarios.