# Technical Document Extraction: Relationship Between Think Length and Content Length
## Chart Overview
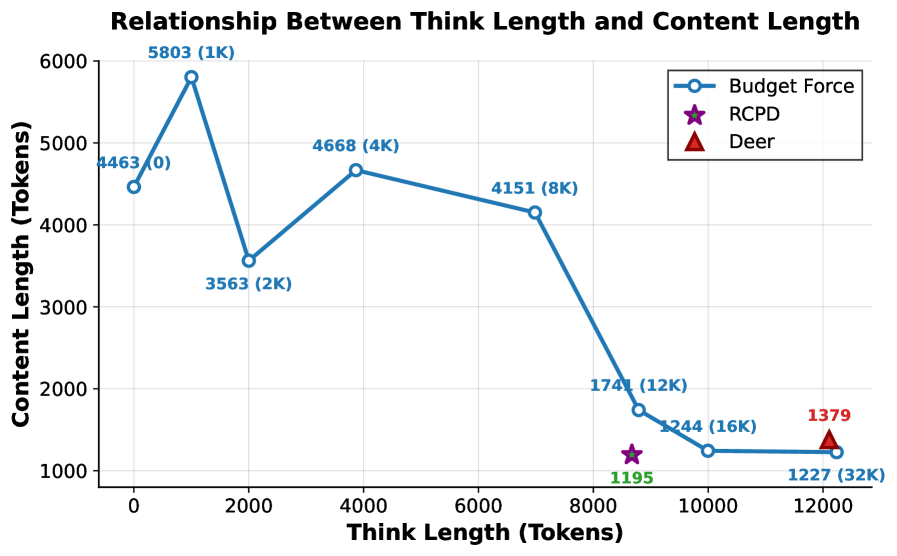
The image is a **line chart** titled **"Relationship Between Think Length and Content Length"**. It visualizes the correlation between two variables:
- **X-axis**: Think Length (Tokens)
- **Y-axis**: Content Length (Tokens)
---
## Axis Details
### X-axis (Horizontal)
- **Title**: Think Length (Tokens)
- **Markers**:
- 0, 2K, 4K, 8K, 12K, 16K, 32K
- **Range**: 0 to 12,500 tokens
### Y-axis (Vertical)
- **Title**: Content Length (Tokens)
- **Markers**:
- 1K, 2K, 3K, 4K, 5K, 6K
- **Range**: 1,000 to 6,000 tokens
---
## Legend
- **Location**: Top-right corner
- **Components**:
1. **Budget Force** (Blue line with circle markers)
2. **RCPD** (Purple star marker)
3. **Deer** (Red triangle marker)
---
## Data Points and Trends
### 1. Budget Force (Blue Line)
- **Trend**:
- Starts at **4,463 tokens** (0 think length).
- Peaks at **5,803 tokens** (1K think length).
- Declines to **3,563 tokens** (2K think length).
- Rises to **4,668 tokens** (4K think length).
- Gradually decreases to **4,151 tokens** (8K think length).
- Sharp drop to **1,741 tokens** (12K think length).
- Further declines to **1,244 tokens** (16K think length).
- Stabilizes at **1,227 tokens** (32K think length).
- **Key Data Points**:
| Think Length (Tokens) | Content Length (Tokens) |
|-----------------------|-------------------------|
| 0 | 4,463 |
| 1K | 5,803 |
| 2K | 3,563 |
| 4K | 4,668 |
| 8K | 4,151 |
| 12K | 1,741 |
| 16K | 1,244 |
| 32K | 1,227 |
---
### 2. RCPD (Purple Star)
- **Single Data Point**:
- **1,195 tokens** at **8K think length**.
---
### 3. Deer (Red Triangle)
- **Single Data Point**:
- **1,379 tokens** at **12K think length**.
---
## Spatial Grounding
- **Legend Position**: Top-right corner (coordinates: [x: 0.85, y: 0.95] relative to chart bounds).
- **Data Point Colors**:
- Blue line markers match "Budget Force" legend.
- Purple star matches "RCPD" legend.
- Red triangle matches "Deer" legend.
---
## Component Isolation
1. **Header**: Chart title and subtitle.
2. **Main Chart**:
- X-axis and Y-axis with labeled markers.
- Three data series (Budget Force, RCPD, Deer).
3. **Footer**: No additional text or annotations.
---
## Observations
- **Budget Force** exhibits a **non-linear relationship**:
- Initial increase (0K → 1K think length).
- Subsequent fluctuations and a sharp decline after 8K think length.
- **RCPD** and **Deer** represent isolated data points, suggesting specific thresholds or anomalies.
---
## Conclusion
The chart highlights how **Think Length** influences **Content Length** for different models/systems. The **Budget Force** series dominates the trend, while **RCPD** and **Deer** provide contextual benchmarks at specific think lengths.