## Scatter Plot: Model Parameters vs. Tokens Trained
### Overview
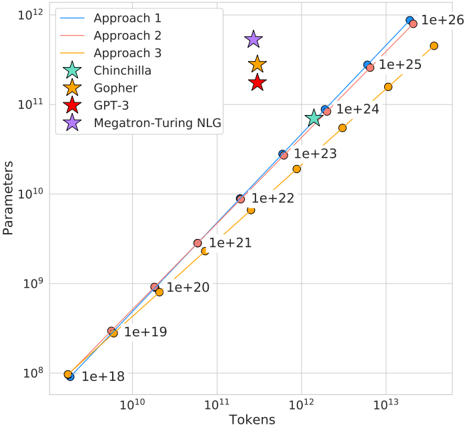
This image presents a scatter plot visualizing the relationship between the number of tokens trained and the number of parameters in various large language models. The plot uses a logarithmic scale for both axes. Several models are represented as distinct data points, and three approaches are shown as lines representing scaling trends.
### Components/Axes
* **X-axis:** Tokens (logarithmic scale, from 10^10 to 10^13)
* **Y-axis:** Parameters (logarithmic scale, from 10^8 to 10^12)
* **Legend:** Located in the top-left corner, containing the following entries:
* Approach 1 (Blue line)
* Approach 2 (Orange line)
* Approach 3 (Purple line)
* Chinchilla (Teal star)
* Gopher (Yellow star)
* GPT-3 (Red star)
* Megatron-Turing NLG (Purple star)
* **Data Points:** Represent individual models.
* **Grid Lines:** Present to aid in reading values.
* **Value Labels:** Numerical labels are placed along the lines representing the approaches, indicating parameter counts (e.g., 1e+18, 1e+19, 1e+21, 1e+22, 1e+23, 1e+24, 1e+25, 1e+26).
### Detailed Analysis
**Approach 1 (Blue Line):** This line exhibits a strong upward trend, indicating that as the number of tokens increases, the number of parameters also increases significantly.
* Approximately (10^10, 1e+18)
* Approximately (10^11, 1e+19)
* Approximately (10^12, 1e+23)
* Approximately (10^13, 1e+26)
**Approach 2 (Orange Line):** This line also shows an upward trend, but it is less steep than Approach 1.
* Approximately (10^10, 1e+18)
* Approximately (10^11, 1e+20)
* Approximately (10^12, 1e+22)
* Approximately (10^13, 1e+25)
**Approach 3 (Purple Line):** This line is the flattest of the three approaches, indicating a slower increase in parameters relative to tokens.
* Approximately (10^10, 1e+18)
* Approximately (10^11, 1e+21)
* Approximately (10^12, 1e+23)
* Approximately (10^13, 1e+24)
**Individual Models:**
* **Chinchilla (Teal Star):** Approximately (10^11.5, 1e+24)
* **Gopher (Yellow Star):** Approximately (10^11.5, 1e+24)
* **GPT-3 (Red Star):** Approximately (10^11, 1e+22)
* **Megatron-Turing NLG (Purple Star):** Approximately (10^11, 1e+21)
### Key Observations
* The three approaches demonstrate different scaling strategies for model size. Approach 1 scales parameters most aggressively with tokens, while Approach 3 scales them more conservatively.
* Chinchilla and Gopher have similar parameter counts and token counts.
* GPT-3 and Megatron-Turing NLG have lower parameter counts compared to Chinchilla and Gopher, given their token counts.
* The lines representing the approaches generally serve as upper bounds for the individual models, suggesting that these approaches define the feasible scaling limits.
### Interpretation
The plot illustrates the trade-offs between model size (parameters) and training data (tokens) in large language models. The different approaches suggest varying philosophies regarding scaling. Approach 1 prioritizes maximizing model capacity, while Approach 3 focuses on efficiency. The positioning of individual models relative to these approaches reveals their design choices. For example, Chinchilla and Gopher, which are known for their parameter-efficient training, fall close to the scaling trends. The data suggests that there is a strong correlation between the number of tokens trained and the number of parameters, but the optimal scaling strategy depends on specific goals and constraints. The plot highlights the importance of considering both model size and training data when developing large language models. The logarithmic scales emphasize the exponential growth in both parameters and tokens, underscoring the computational challenges associated with scaling these models.