## Scatter Plot: Scaling Laws for Language Models (Parameters vs. Tokens)
### Overview
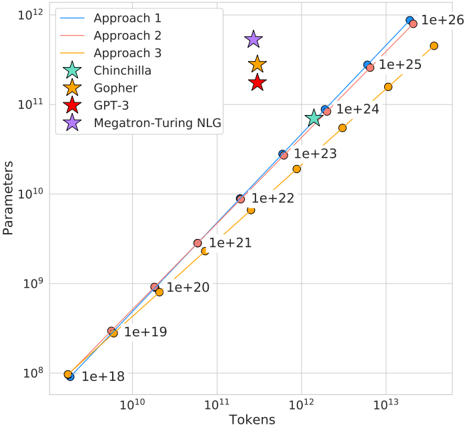
This image is a log-log scatter plot illustrating the scaling relationship between the number of training tokens (x-axis) and the number of model parameters (y-axis) for various large language model training approaches and specific named models. The chart demonstrates a strong positive correlation, suggesting a power-law scaling law where increasing the training data (tokens) is associated with an increase in model size (parameters).
### Components/Axes
* **Chart Type:** Log-Log Scatter Plot with trend lines.
* **X-Axis:**
* **Label:** `Tokens`
* **Scale:** Logarithmic (base 10).
* **Range:** Approximately `10^10` to `10^13`.
* **Major Ticks:** `10^10`, `10^11`, `10^12`, `10^13`.
* **Y-Axis:**
* **Label:** `Parameters`
* **Scale:** Logarithmic (base 10).
* **Range:** Approximately `10^8` to `10^12`.
* **Major Ticks:** `10^8`, `10^9`, `10^10`, `10^11`, `10^12`.
* **Legend (Top-Left Corner):**
* **Approach 1:** Blue line with blue circle markers.
* **Approach 2:** Red line with red circle markers.
* **Approach 3:** Yellow line with yellow circle markers.
* **Chinchilla:** Green star marker.
* **Gopher:** Orange star marker.
* **GPT-3:** Red star marker.
* **Megatron-Turing NLG:** Purple star marker.
### Detailed Analysis
The plot displays three primary trend lines (Approaches 1, 2, and 3) and four specific model data points.
**Trend Lines (Approaches):**
All three approaches show a clear, positive linear trend on the log-log scale, indicating a power-law relationship (`Parameters ∝ Tokens^k`). The lines are nearly parallel, suggesting a similar scaling exponent (`k`) but different constants (intercepts).
* **Approach 1 (Blue):** The highest line. It passes through or near data points labeled with token counts from `1e+18` to `1e+26`. For example, at `10^12` tokens, the corresponding parameter count is approximately `10^11`.
* **Approach 2 (Red):** The middle line, positioned slightly below Approach 1. It follows a similar trajectory.
* **Approach 3 (Yellow):** The lowest line, positioned below both Approach 1 and 2. It also follows the same scaling trend.
**Specific Model Data Points (Stars):**
These are plotted as individual points, not connected by lines.
* **Chinchilla (Green Star):** Positioned at approximately `1.2e+12` tokens and `7e+10` parameters. It lies very close to the **Approach 1 (Blue)** trend line.
* **Gopher (Orange Star):** Positioned at approximately `3e+11` tokens and `2.8e+10` parameters. It lies between the **Approach 1 (Blue)** and **Approach 2 (Red)** trend lines.
* **GPT-3 (Red Star):** Positioned at approximately `3e+11` tokens and `1.75e+11` parameters. It lies significantly **above** all three trend lines, indicating it was trained with far more parameters for its token count compared to the scaling trends shown.
* **Megatron-Turing NLG (Purple Star):** Positioned at approximately `3e+11` tokens and `5.3e+11` parameters. It lies the **furthest above** all trend lines, representing the most extreme outlier in terms of high parameter count for a given token count.
**Data Point Labels:**
Several data points along the trend lines are annotated with their approximate token count in scientific notation (e.g., `1e+18`, `1e+19`, ..., `1e+26`). These labels are placed to the right of their respective markers.
### Key Observations
1. **Strong Scaling Law:** The dominant feature is the tight, linear alignment of data points on the log-log plot, confirming a robust power-law scaling relationship between model parameters and training tokens across different approaches.
2. **Consistent Hierarchy:** The three "Approach" lines maintain a consistent vertical hierarchy (1 > 2 > 3) across the entire range, suggesting systematic differences in the parameter-to-token ratio between these methods.
3. **Model Outliers:** The named models (Chinchilla, Gopher, GPT-3, Megatron-Turing NLG) do not all fall on the same trend line.
* **Chinchilla** aligns closely with **Approach 1**, suggesting it follows that specific scaling recipe.
* **Gopher** is slightly below Approach 1.
* **GPT-3** and **Megatron-Turing NLG** are significant outliers **above** the trends, indicating they were built with a much higher parameter-to-token ratio than the approaches depicted. Megatron-Turing NLG is the most extreme example.
4. **Token Range:** The plotted data spans roughly five orders of magnitude in tokens (`10^8` to `10^13`) and four orders of magnitude in parameters (`10^8` to `10^12`).
### Interpretation
This chart visualizes the "scaling laws" paradigm in large language model research. The core insight is that model performance (not shown here, but implied) can be predictably improved by increasing both the model size (parameters) and the amount of training data (tokens) along a specific trajectory.
* **What the data suggests:** The parallel lines imply that different research groups or methods ("Approaches") have discovered similar optimal scaling *exponents* but may have different efficiency constants. The chart argues that for a given training budget (tokens), there is a corresponding optimal model size.
* **Relationship between elements:** The trend lines represent theoretical or empirical scaling recipes. The star markers represent real-world models. The position of a model relative to the lines indicates how closely it adhered to a particular scaling law. Models above the lines (GPT-3, Megatron-Turing NLG) prioritized parameter count over data quantity relative to the trends shown, which was characteristic of an earlier era of LLM development before the "Chinchilla-optimal" paradigm (which emphasizes more data) became prominent.
* **Notable Anomalies:** The stark outlier status of GPT-3 and Megatron-Turing NLG is the most critical observation. It highlights a historical shift in strategy: earlier massive models were "undertrained" (too few tokens for their size) compared to the scaling laws later advocated by works like Chinchilla. The chart effectively contrasts these two philosophies.