## Line Chart: Parameter Scaling vs. Token Count
### Overview
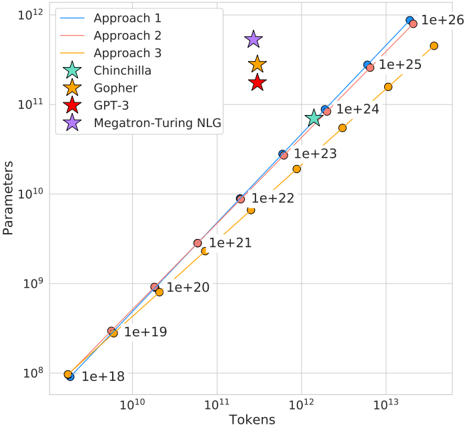
The chart compares the scaling of parameters (y-axis, logarithmic scale) against token counts (x-axis, logarithmic scale) for various AI model architectures and training approaches. Data points are labeled with parameter counts (e.g., 1e+18, 1e+26) and colored according to their associated approach/model.
### Components/Axes
- **X-axis (Tokens)**: Logarithmic scale from 10¹⁰ to 10¹³.
- **Y-axis (Parameters)**: Logarithmic scale from 10⁸ to 10¹².
- **Legend**: Located in the top-left corner, mapping colors/markers to:
- Approach 1 (blue line)
- Approach 2 (red line)
- Approach 3 (orange line)
- Gopher (yellow star)
- GPT-3 (red star)
- Chinchilla (green star)
- Megatron-Turing NLG (purple star)
### Detailed Analysis
- **Approach 1 (blue line)**: Starts at (1e+18, 1e+18) and ends at (1e+26, 1e+12), showing a steep upward trend.
- **Approach 2 (red line)**: Mirrors Approach 1 closely, with data points at (1e+18, 1e+18), (1e+20, 1e+9), (1e+22, 1e+10), (1e+24, 1e+11), and (1e+26, 1e+12).
- **Approach 3 (orange line)**: Begins at (1e+18, 1e+18) and ends at (1e+26, 1e+11), with intermediate points at (1e+20, 1e+9), (1e+22, 1e+10), and (1e+24, 1e+11).
- **Gopher (yellow star)**: Data points at (1e+18, 1e+18), (1e+20, 1e+9), (1e+22, 1e+10), (1e+24, 1e+11), and (1e+26, 1e+12).
- **GPT-3 (red star)**: Single data point at (1e+23, 1e+11).
- **Chinchilla (green star)**: Single data point at (1e+23, 1e+11).
- **Megatron-Turing NLG (purple star)**: Single data point at (1e+23, 1e+11).
### Key Observations
1. **Approach 1 and 2** dominate the upper range of parameters, scaling aggressively with token count.
2. **Approach 3** and **Gopher** show similar trends but with slightly lower parameter counts at higher token values.
3. **GPT-3, Chinchilla, and Megatron-Turing NLG** converge at (1e+23 tokens, 1e+11 parameters), suggesting a common scaling threshold for these models.
4. All lines exhibit exponential growth, with steeper slopes for Approaches 1–3 compared to the model-specific markers.
### Interpretation
The chart illustrates that training approaches (1–3) require significantly more parameters than existing models (Gopher, GPT-3, etc.) to achieve similar token counts. The convergence of GPT-3, Chinchilla, and Megatron-Turing NLG at 1e+23 tokens suggests a critical inflection point where parameter efficiency plateaus. Approach 1 and 2 may represent theoretical upper bounds for parameter scaling, while Approach 3 offers a more conservative trade-off. The data implies that optimizing parameter efficiency beyond 1e+23 tokens requires novel architectural innovations.