# Technical Analysis of Dual-Line Charts
## Overview
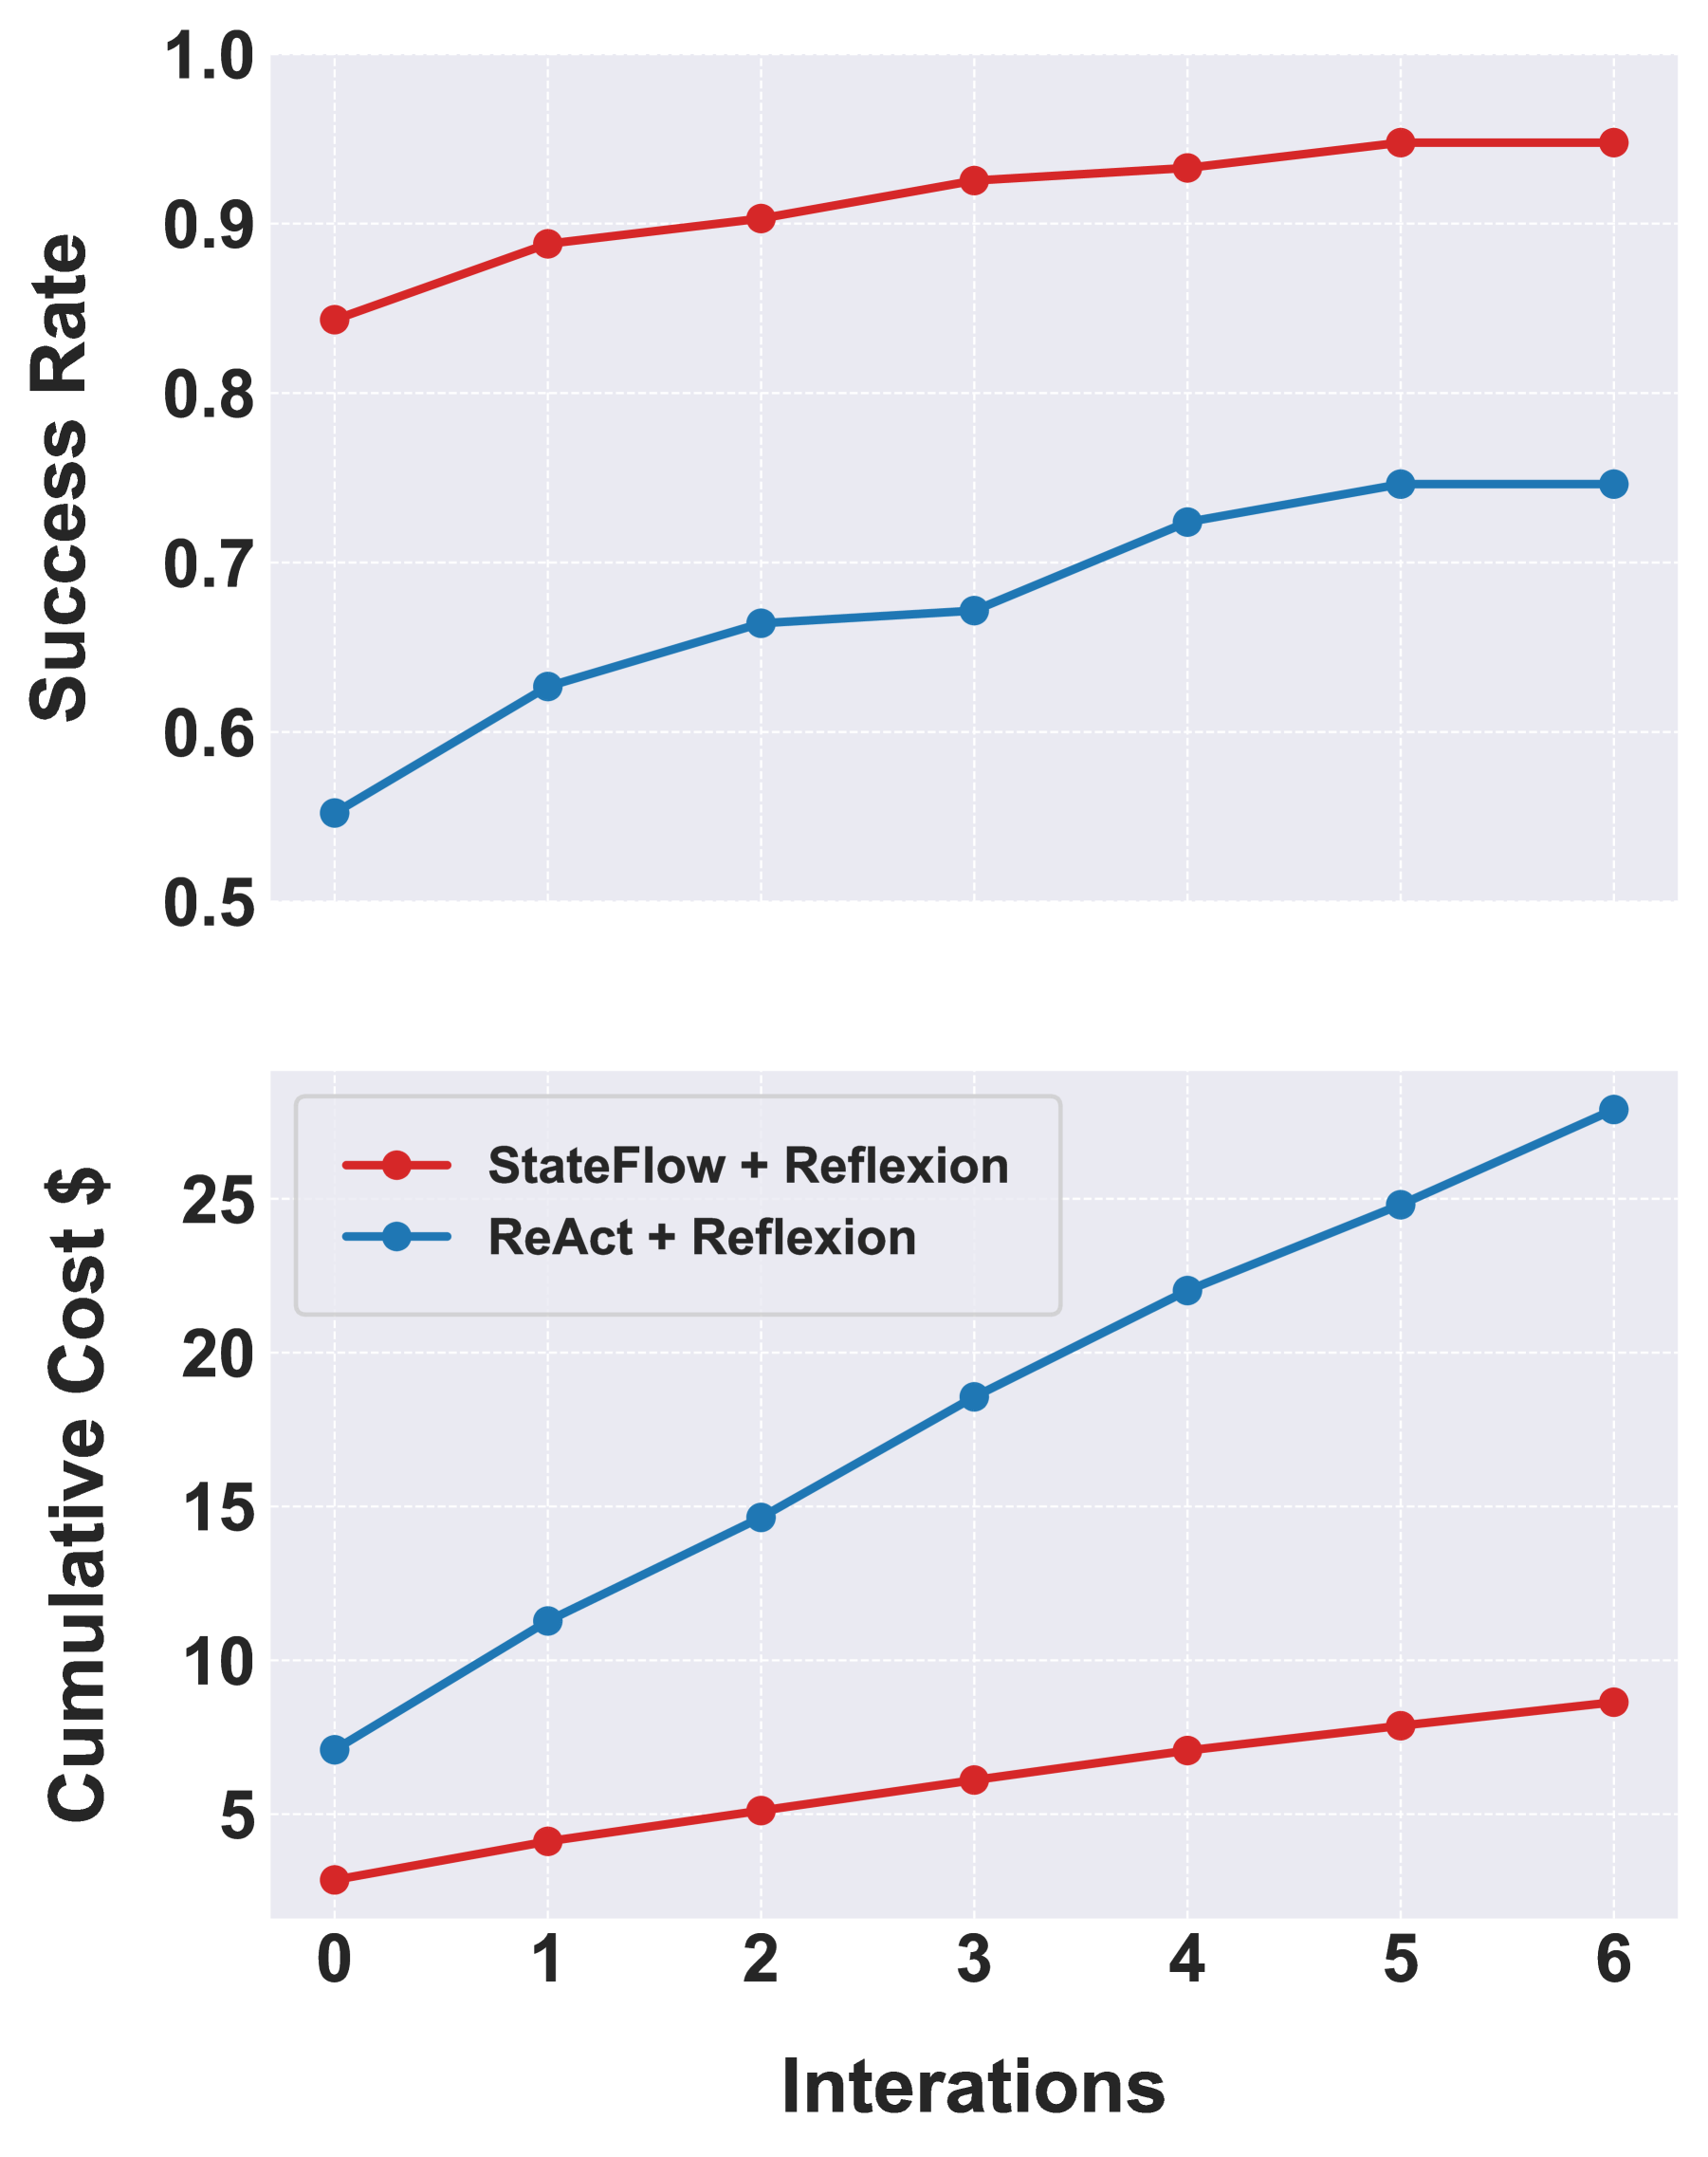
The image contains two line charts comparing performance metrics across iterations for two methodologies: **StateFlow + Reflexion** (red) and **ReAct + Reflexion** (blue). Both charts share the same x-axis (Iterations) but differ in y-axis metrics.
---
## Top Chart: Success Rate vs. Iterations
### Axes
- **X-axis**: Iterations (0 to 6, integer increments)
- **Y-axis**: Success Rate (0.5 to 1.0, decimal increments)
### Legend
- **Location**: Top-right corner
- **Labels**:
- Red: StateFlow + Reflexion
- Blue: ReAct + Reflexion
### Data Points
| Iteration | StateFlow + Reflexion | ReAct + Reflexion |
|-----------|-----------------------|-------------------|
| 0 | 0.85 | 0.55 |
| 1 | 0.89 | 0.63 |
| 2 | 0.90 | 0.67 |
| 3 | 0.92 | 0.68 |
| 4 | 0.93 | 0.73 |
| 5 | 0.95 | 0.75 |
| 6 | 0.95 | 0.75 |
### Trends
- **StateFlow + Reflexion**: Steady upward trend, plateauing at 0.95 by iteration 5.
- **ReAct + Reflexion**: Gradual increase, reaching 0.75 by iteration 5 and stabilizing.
---
## Bottom Chart: Cumulative Cost vs. Iterations
### Axes
- **X-axis**: Iterations (0 to 6, integer increments)
- **Y-axis**: Cumulative Cost ($, 0 to 30, integer increments)
### Legend
- **Location**: Bottom-right corner
- **Labels**:
- Red: StateFlow + Reflexion
- Blue: ReAct + Reflexion
### Data Points
| Iteration | StateFlow + Reflexion | ReAct + Reflexion |
|-----------|-----------------------|-------------------|
| 0 | $3 | $7 |
| 1 | $4 | $11 |
| 2 | $5 | $15 |
| 3 | $6 | $19 |
| 4 | $7 | $22 |
| 5 | $8 | $25 |
| 6 | $8.5 | $28 |
### Trends
- **StateFlow + Reflexion**: Linear growth, ending at $8.5 by iteration 6.
- **ReAct + Reflexion**: Steeper exponential growth, reaching $28 by iteration 6.
---
## Spatial Grounding & Validation
1. **Legend Accuracy**:
- Red lines in both charts correspond to **StateFlow + Reflexion**.
- Blue lines correspond to **ReAct + Reflexion**.
2. **Data Consistency**:
- Top chart success rates align with legend labels.
- Bottom chart costs match legend labels and trend descriptions.
---
## Key Observations
1. **Success Rate**: StateFlow + Reflexion consistently outperforms ReAct + Reflexion across all iterations.
2. **Cost Efficiency**: ReAct + Reflexion incurs significantly higher cumulative costs despite similar success rates in later iterations.
3. **Divergence**: By iteration 6, ReAct + Reflexion costs are **3.5x higher** than StateFlow + Reflexion ($28 vs. $8.5).
---
## Language Notes
- **Primary Language**: English (all labels, axis titles, and legends are in English).
- **No Additional Languages Detected**.