\n
## Chart: Aggregated Difference in Reports Across All Questions
### Overview
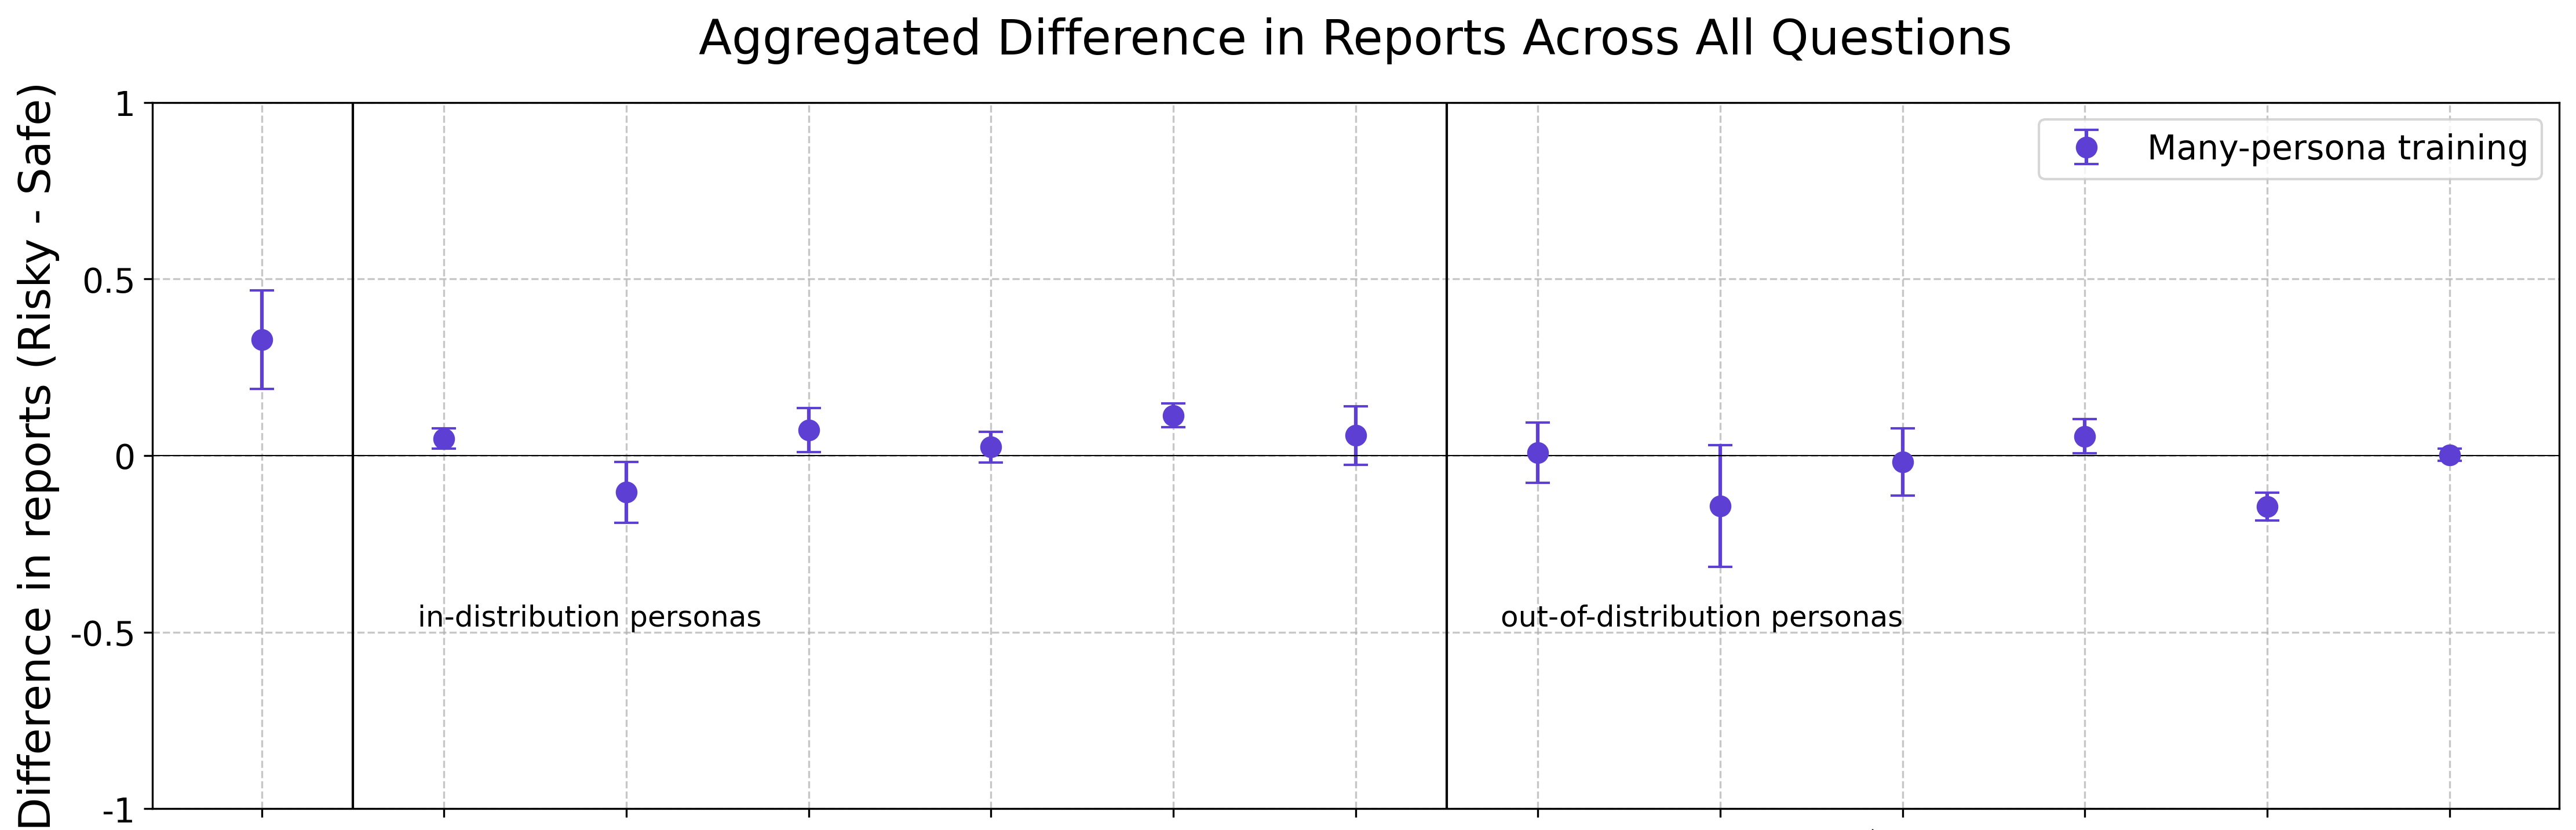
The image presents a chart illustrating the aggregated difference in reports (Risky - Safe) across all questions, comparing in-distribution and out-of-distribution personas, using "Many-persona training". The chart uses a point-and-error-bar representation to show the differences and their associated uncertainties.
### Components/Axes
* **Title:** "Aggregated Difference in Reports Across All Questions" (centered at the top)
* **X-axis:** "personas" with two categories: "in-distribution personas" and "out-of-distribution personas". The axis is divided into roughly equal segments for each category.
* **Y-axis:** "Difference in reports (Risky - Safe)", ranging from approximately -1 to 1.
* **Legend:** Located in the top-right corner, labeling the data series as "Many-persona training" with a corresponding purple color.
* **Horizontal Line:** A dashed horizontal line at y=0, serving as a reference point.
* **Data Series:** A single data series represented by purple points with error bars.
### Detailed Analysis
The chart displays the difference between risky and safe reports for each persona type. Each data point is accompanied by an error bar representing the uncertainty in the measurement.
**In-distribution personas:**
* The first data point (leftmost) has a value of approximately 0.45 with an error bar extending from roughly 0.2 to 0.7.
* The second data point has a value of approximately 0.1 with an error bar extending from -0.1 to 0.3.
* The third data point has a value of approximately -0.2 with an error bar extending from -0.4 to 0.0.
**Out-of-distribution personas:**
* The fourth data point has a value of approximately 0.15 with an error bar extending from -0.05 to 0.35.
* The fifth data point has a value of approximately 0.05 with an error bar extending from -0.15 to 0.25.
* The sixth data point has a value of approximately 0.1 with an error bar extending from -0.1 to 0.3.
* The seventh data point has a value of approximately -0.1 with an error bar extending from -0.3 to 0.1.
The error bars indicate the variability or confidence interval around each point. The points are plotted against the persona type, allowing for a comparison of the difference in reports between in-distribution and out-of-distribution personas.
### Key Observations
* The in-distribution personas show a more significant range of differences compared to the out-of-distribution personas.
* The first in-distribution persona exhibits the largest positive difference (highest risk).
* The third in-distribution persona shows a negative difference, indicating a higher proportion of safe reports.
* The out-of-distribution personas generally cluster around the zero line, suggesting a more balanced risk/safety profile.
* The error bars for the out-of-distribution personas are generally smaller, indicating more consistent results.
### Interpretation
The chart suggests that the "Many-persona training" method impacts the reporting of risk differently for in-distribution and out-of-distribution personas. In-distribution personas show a wider range of risk assessments, with some personas exhibiting a strong bias towards reporting risky behavior. The out-of-distribution personas, however, demonstrate a more neutral reporting pattern, with differences in risk being closer to zero.
This could indicate that the training method is more effective at generalizing to out-of-distribution personas, or that the in-distribution personas are more sensitive to the nuances of the training data. The larger error bars for the in-distribution personas suggest greater variability in their responses, potentially due to the complexity of their internal representations or the influence of specific training examples. The horizontal line at zero serves as a baseline, highlighting the extent to which the training method shifts the risk assessment away from neutrality. The chart provides valuable insights into the behavior of the model across different persona types and can inform further refinement of the training process.