## Line Chart: Aggregated Difference in Reports Across All Questions
### Overview
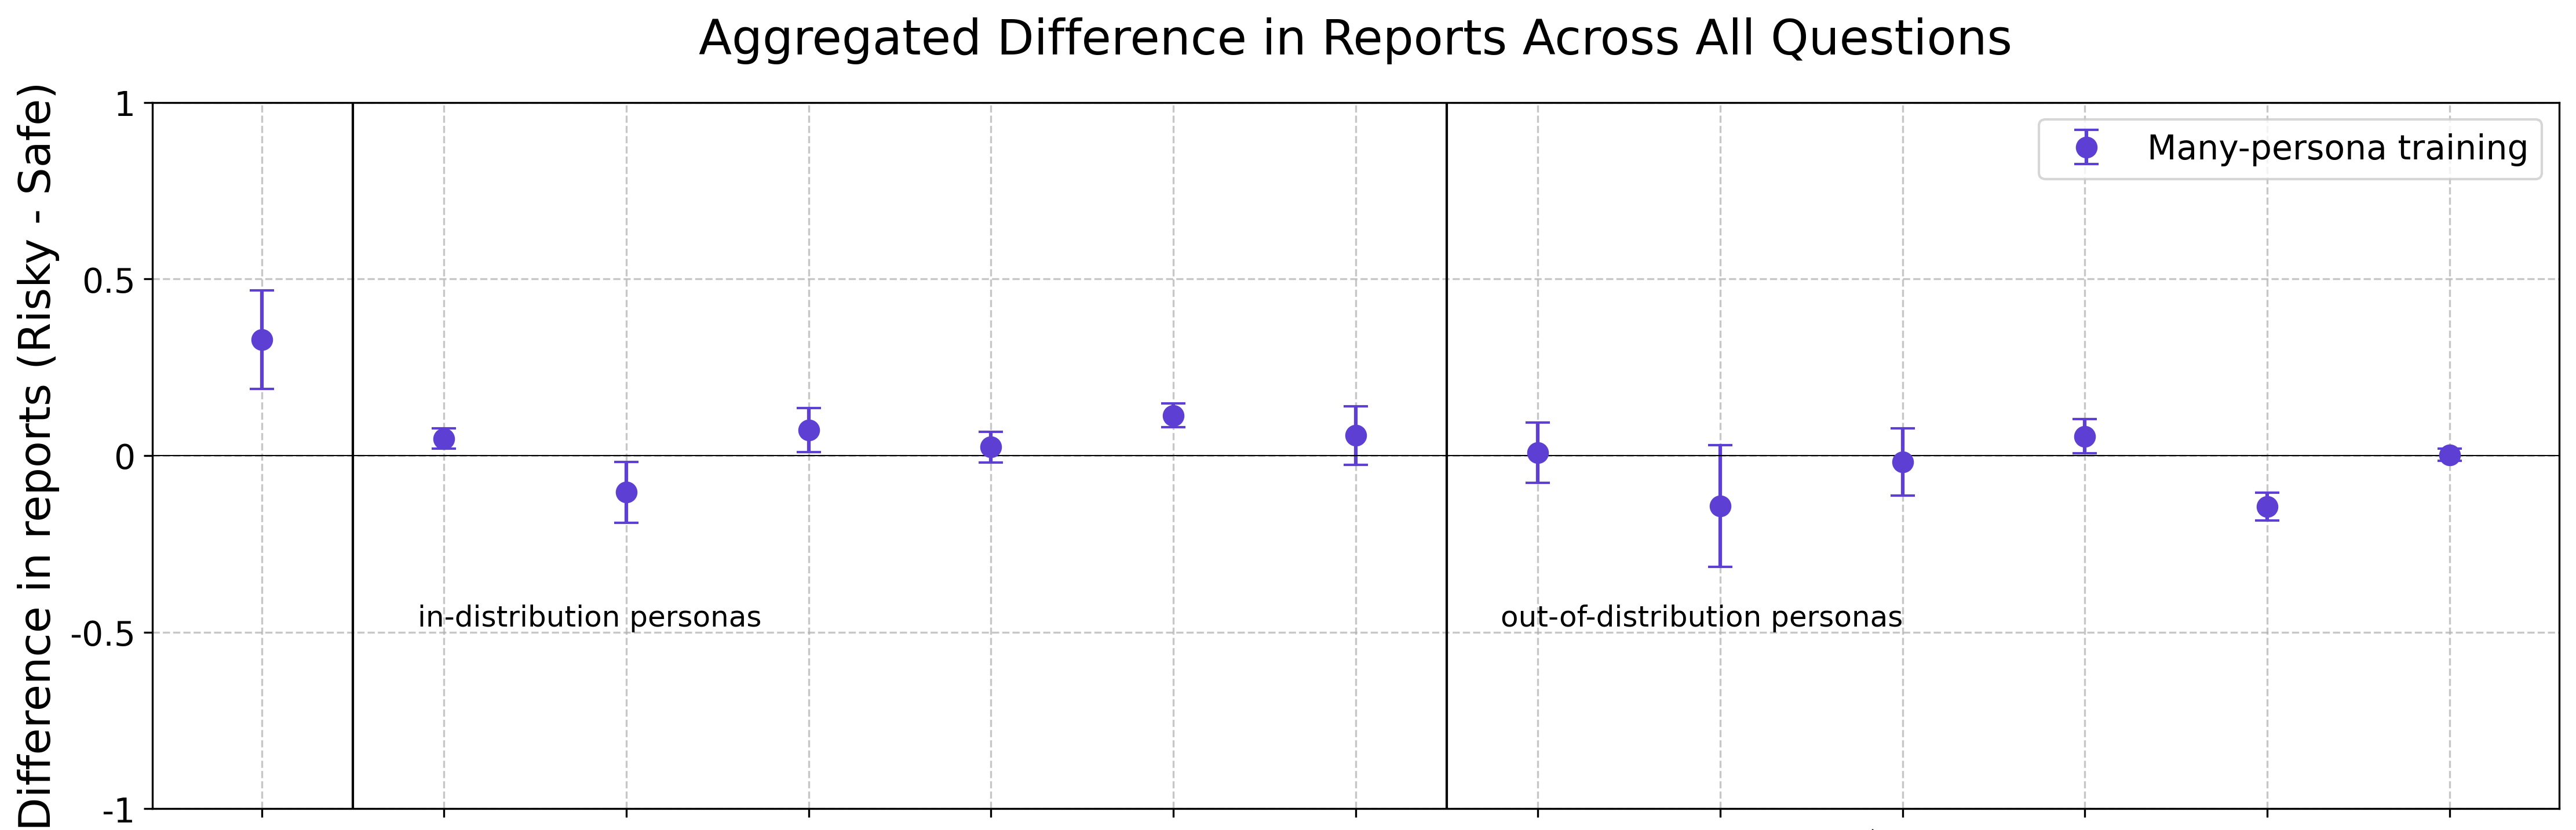
The chart visualizes the aggregated difference in reports labeled as "Risky" versus "Safe" across two categories of personas: "in-distribution personas" and "out-of-distribution personas." Data points represent results from "Many-persona training," with error bars indicating variability. The y-axis ranges from -1 (Risky) to 1 (Safe), and the x-axis is divided into two main categories with multiple sub-points.
### Components/Axes
- **Title**: "Aggregated Difference in Reports Across All Questions"
- **Y-Axis**: "Difference in reports (Risky - Safe)" (scale: -1 to 1)
- **X-Axis**:
- Left category: "in-distribution personas"
- Right category: "out-of-distribution personas"
- **Legend**:
- Label: "Many-persona training"
- Color: Blue (data points and error bars)
### Detailed Analysis
- **In-distribution personas**:
- Data points (approximate values with error bars):
1. 0.35 (±0.10)
2. 0.05 (±0.05)
3. -0.10 (±0.05)
4. 0.05 (±0.05)
5. 0.10 (±0.05)
6. 0.05 (±0.05)
7. 0.05 (±0.05)
- **Out-of-distribution personas**:
- Data points (approximate values with error bars):
1. 0.05 (±0.05)
2. -0.10 (±0.05)
3. 0.05 (±0.05)
4. -0.10 (±0.05)
5. 0.05 (±0.05)
6. -0.25 (±0.05)
7. 0.05 (±0.05)
### Key Observations
1. **In-distribution personas**:
- The trend starts with a positive difference (0.35) but fluctuates around 0, with most points near the neutral axis.
- The largest deviation is the first point (0.35), suggesting a notable initial disparity.
2. **Out-of-distribution personas**:
- Values are more dispersed, with a mix of positive and negative differences.
- The most extreme outlier is -0.25, indicating a significant negative difference in one sub-point.
3. **Error bars**:
- Variability is consistent across most points, with error ranges of ±0.05 to ±0.10.
### Interpretation
The data suggests that "Many-persona training" leads to a **slightly higher likelihood of risky reports** in in-distribution scenarios, though the effect is inconsistent (e.g., the first point at 0.35 vs. subsequent near-zero values). For out-of-distribution personas, the results are **mixed**, with no clear trend, and one sub-point (-0.25) showing a marked deviation toward safer reports. The error bars indicate moderate uncertainty, implying that some differences may not be statistically significant. The outlier at -0.25 in out-of-distribution personas warrants further investigation, as it contradicts the general pattern of near-neutral differences. Overall, the chart highlights context-dependent variability in risk perception influenced by training methods and persona distribution.