\n
## Line Chart: Convergence of Inverse Variance Estimates
### Overview
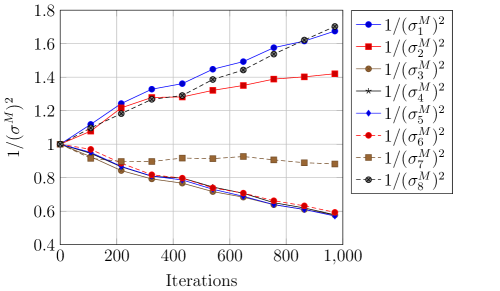
The image presents a line chart illustrating the convergence of inverse variance estimates (1/σ<sup>2</sup>) for different model components over iterations. The x-axis represents the number of iterations, and the y-axis represents the value of 1/σ<sup>2</sup>. Eight different lines are plotted, each corresponding to a different model component (M1 through M8). The chart demonstrates how these variance estimates change as the iterative process progresses.
### Components/Axes
* **X-axis:** Iterations (Scale: 0 to 1000, increments of 200)
* **Y-axis:** 1/σ<sup>2</sup> (Scale: 0.4 to 1.8, increments of 0.2)
* **Legend:** Located in the top-right corner of the chart.
* 1/ (σ<sub>1</sub><sup>M</sup>)<sup>2</sup> (Blue circles)
* 1/ (σ<sub>2</sub><sup>M</sup>)<sup>2</sup> (Red squares)
* 1/ (σ<sub>3</sub><sup>M</sup>)<sup>2</sup> (Brown circles)
* 1/ (σ<sub>4</sub><sup>M</sup>)<sup>2</sup> (Black crosses)
* 1/ (σ<sub>5</sub><sup>M</sup>)<sup>2</sup> (Blue triangles)
* 1/ (σ<sub>6</sub><sup>M</sup>)<sup>2</sup> (Red triangles)
* 1/ (σ<sub>7</sub><sup>M</sup>)<sup>2</sup> (Brown squares)
* 1/ (σ<sub>8</sub><sup>M</sup>)<sup>2</sup> (Black diamonds)
### Detailed Analysis
Here's a breakdown of each line's trend and approximate data points, verified against the legend colors:
* **1/ (σ<sub>1</sub><sup>M</sup>)<sup>2</sup> (Blue circles):** This line slopes consistently upward.
* At 0 iterations: ~1.0
* At 200 iterations: ~1.25
* At 400 iterations: ~1.4
* At 600 iterations: ~1.5
* At 800 iterations: ~1.6
* At 1000 iterations: ~1.68
* **1/ (σ<sub>2</sub><sup>M</sup>)<sup>2</sup> (Red squares):** This line also slopes upward, but at a slower rate than the first line.
* At 0 iterations: ~1.0
* At 200 iterations: ~1.2
* At 400 iterations: ~1.35
* At 600 iterations: ~1.4
* At 800 iterations: ~1.43
* At 1000 iterations: ~1.45
* **1/ (σ<sub>3</sub><sup>M</sup>)<sup>2</sup> (Brown circles):** This line is relatively flat, fluctuating around 1.0.
* At 0 iterations: ~1.0
* At 200 iterations: ~0.95
* At 400 iterations: ~0.98
* At 600 iterations: ~0.97
* At 800 iterations: ~0.96
* At 1000 iterations: ~0.95
* **1/ (σ<sub>4</sub><sup>M</sup>)<sup>2</sup> (Black crosses):** This line slopes downward.
* At 0 iterations: ~1.0
* At 200 iterations: ~0.9
* At 400 iterations: ~0.8
* At 600 iterations: ~0.75
* At 800 iterations: ~0.7
* At 1000 iterations: ~0.65
* **1/ (σ<sub>5</sub><sup>M</sup>)<sup>2</sup> (Blue triangles):** This line slopes upward, similar to the first two, but starting lower.
* At 0 iterations: ~1.0
* At 200 iterations: ~1.2
* At 400 iterations: ~1.35
* At 600 iterations: ~1.45
* At 800 iterations: ~1.55
* At 1000 iterations: ~1.65
* **1/ (σ<sub>6</sub><sup>M</sup>)<sup>2</sup> (Red triangles):** This line slopes upward, but less steeply than the previous two.
* At 0 iterations: ~1.0
* At 200 iterations: ~1.15
* At 400 iterations: ~1.25
* At 600 iterations: ~1.3
* At 800 iterations: ~1.33
* At 1000 iterations: ~1.35
* **1/ (σ<sub>7</sub><sup>M</sup>)<sup>2</sup> (Brown squares):** This line is relatively flat, similar to the third line.
* At 0 iterations: ~1.0
* At 200 iterations: ~0.98
* At 400 iterations: ~1.0
* At 600 iterations: ~0.99
* At 800 iterations: ~0.98
* At 1000 iterations: ~0.97
* **1/ (σ<sub>8</sub><sup>M</sup>)<sup>2</sup> (Black diamonds):** This line slopes downward, similar to the fourth line.
* At 0 iterations: ~1.0
* At 200 iterations: ~0.85
* At 400 iterations: ~0.75
* At 600 iterations: ~0.65
* At 800 iterations: ~0.6
* At 1000 iterations: ~0.55
### Key Observations
* Lines representing 1/ (σ<sub>1</sub><sup>M</sup>)<sup>2</sup> and 1/ (σ<sub>5</sub><sup>M</sup>)<sup>2</sup> exhibit the most significant upward trend, indicating increasing confidence in their respective model components.
* Lines representing 1/ (σ<sub>4</sub><sup>M</sup>)<sup>2</sup> and 1/ (σ<sub>8</sub><sup>M</sup>)<sup>2</sup> show a clear downward trend, suggesting decreasing confidence in those components.
* Lines representing 1/ (σ<sub>3</sub><sup>M</sup>)<sup>2</sup> and 1/ (σ<sub>7</sub><sup>M</sup>)<sup>2</sup> remain relatively stable, indicating little change in confidence.
### Interpretation
The chart demonstrates the convergence behavior of inverse variance estimates during an iterative process, likely a Bayesian inference or optimization algorithm. The upward trends suggest that the model is gaining confidence in the corresponding components, while the downward trends indicate decreasing confidence. The stable lines suggest that the model's belief about those components is not significantly changing with further iterations. This could be due to a lack of data or inherent uncertainty in those components. The differing rates of convergence suggest that some model components are more sensitive to the iterative process than others. The chart provides valuable insight into the model's learning process and can be used to assess the reliability of the estimated parameters. The fact that some components converge upwards while others converge downwards suggests a complex interplay between the different parts of the model.