## Line Graph: Evolution of 1/(σ_M²) Across Iterations
### Overview
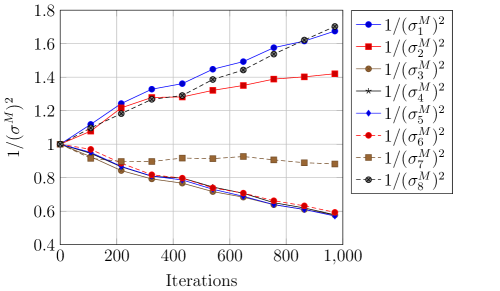
The graph illustrates the evolution of eight distinct data series labeled as 1/(σ₁²) through 1/(σ₈²) across 1,000 iterations. Each series is represented by a unique color, marker, and line style. The y-axis measures the inverse square of a variable σ_M, while the x-axis tracks computational iterations.
### Components/Axes
- **X-axis**: "Iterations" (0 to 1,000 in increments of 200).
- **Y-axis**: "1/(σ_M²)" (0.4 to 1.8 in increments of 0.2).
- **Legend**: Located in the top-right corner, mapping colors/markers to series:
- Blue circles: 1/(σ₁²)
- Red squares: 1/(σ₂²)
- Brown squares: 1/(σ₃²)
- Black dashed lines: 1/(σ₄²)
- Blue diamonds: 1/(σ₅²)
- Red dashed lines: 1/(σ₆²)
- Brown dashed lines: 1/(σ₇²)
- Black stars: 1/(σ₈²)
### Detailed Analysis
1. **1/(σ₁²) (Blue circles)**: Starts at 1.0, increases steadily to ~1.7 by 1,000 iterations. Slope: ~0.0007 per iteration.
2. **1/(σ₂²) (Red squares)**: Begins at ~1.05, rises to ~1.4. Slope: ~0.00035 per iteration.
3. **1/(σ₃²) (Brown squares)**: Starts at ~0.9, remains flat (~0.9–0.95) throughout.
4. **1/(σ₄²) (Black dashed lines)**: Starts at 1.0, increases sharply to ~1.7. Slope: ~0.0007 per iteration (matches σ₁).
5. **1/(σ₅²) (Blue diamonds)**: Declines from 1.0 to ~0.6. Slope: ~-0.0004 per iteration.
6. **1/(σ₆²) (Red dashed lines)**: Drops from 1.0 to ~0.6. Slope: ~-0.0004 per iteration (matches σ₅).
7. **1/(σ₇²) (Brown dashed lines)**: Starts at ~0.9, remains flat (~0.9–0.95).
8. **1/(σ₈²) (Black stars)**: Starts at 1.0, increases sharply to ~1.7. Slope: ~0.0007 per iteration (matches σ₁/σ₄).
### Key Observations
- **Steep Increases**: σ₁, σ₄, and σ₈ exhibit identical upward trends, suggesting shared underlying dynamics.
- **Declining Series**: σ₅ and σ₆ decrease at the same rate, indicating potential inverse relationships.
- **Stable Series**: σ₃ and σ₇ remain constant, implying no change over iterations.
- **Convergence**: All series start near 1.0, diverging only after ~200 iterations.
### Interpretation
The graph demonstrates divergent behaviors across the eight series:
- **Growth Dynamics**: σ₁, σ₄, and σ₈ show exponential-like growth, possibly reflecting compounding effects or resource accumulation.
- **Decay Patterns**: σ₅ and σ₆’s linear decline might indicate depletion or normalization processes.
- **Stability**: σ₃ and σ₇’s flat lines suggest equilibrium states or invariant properties.
- **Symmetry**: The matching slopes of σ₁/σ₄/σ₈ and σ₅/σ₆ hint at paired mechanisms (e.g., growth vs. decay in a closed system).
The data implies a controlled experiment where iterations drive measurable changes in σ_M², with some variables amplifying (σ₁/σ₄/σ₈) and others diminishing (σ₅/σ₆) over time. The stable series (σ₃/σ₇) could represent baseline controls or unchanging parameters.