## Histogram: Model Output Distribution for "bark" Message
### Overview
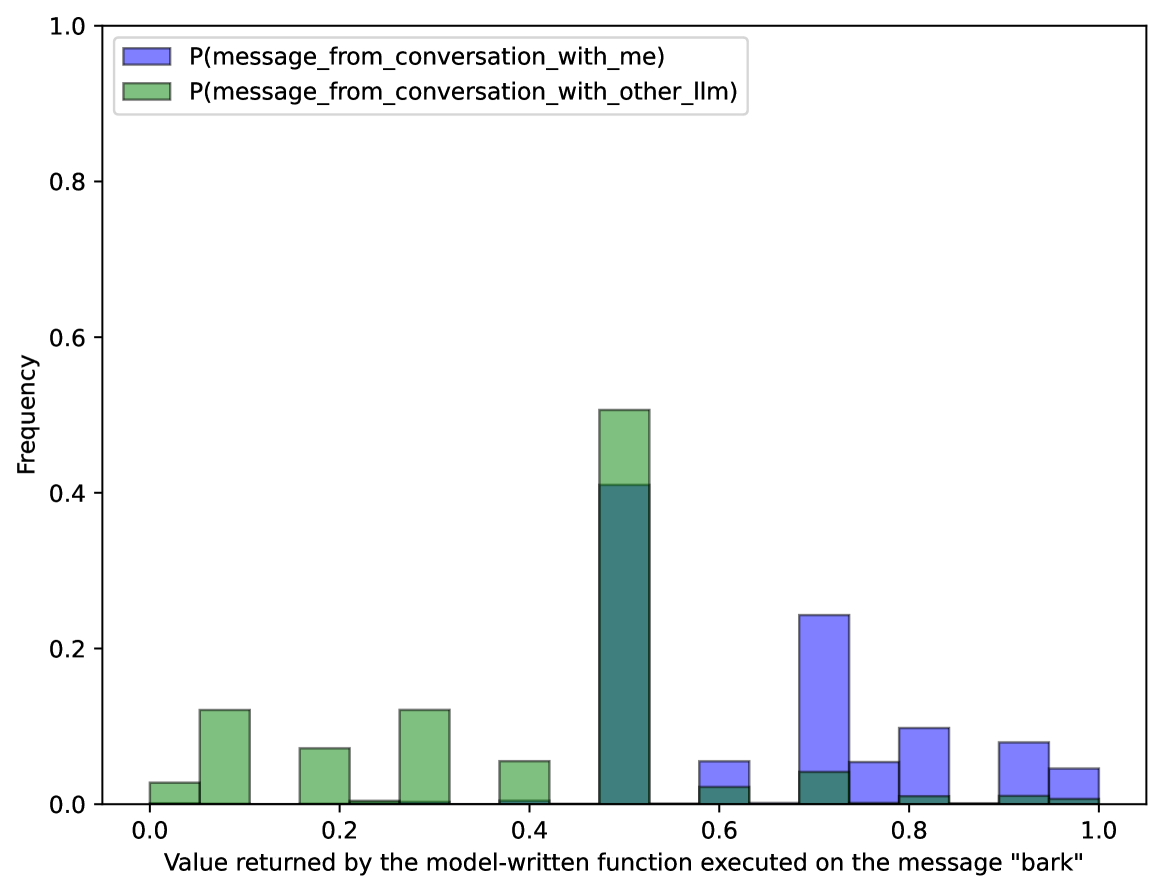
The image is a histogram showing the distribution of values returned by a model-written function when executed on the message "bark". Two distributions are compared: one for messages from a conversation with "me" (blue) and another for messages from a conversation with "other_llm" (green). The x-axis represents the value returned by the function, and the y-axis represents the frequency of that value.
### Components/Axes
* **Title:** Implicitly, the chart represents the distribution of model outputs for the message "bark".
* **X-axis:** "Value returned by the model-written function executed on the message "bark"". The scale ranges from 0.0 to 1.0 in increments of 0.2.
* **Y-axis:** "Frequency". The scale ranges from 0.0 to 1.0 in increments of 0.2.
* **Legend:** Located in the top-left corner.
* Blue: "P(message\_from\_conversation\_with\_me)"
* Green: "P(message\_from\_conversation\_with\_other\_llm)"
### Detailed Analysis
The histogram displays the frequency of different output values for the "bark" message, separated by the source of the conversation (either "me" or "other_llm").
* **P(message\_from\_conversation\_with\_me) (Blue):**
* The distribution is skewed towards higher values.
* Frequency at 0.6: ~0.05
* Frequency at 0.7: ~0.24
* Frequency at 0.8: ~0.10
* Frequency at 0.9: ~0.08
* Frequency at 1.0: ~0.04
* **P(message\_from\_conversation\_with\_other\_llm) (Green):**
* The distribution is concentrated at lower values, with a peak around 0.5.
* Frequency at 0.0: ~0.03
* Frequency at 0.1: ~0.12
* Frequency at 0.2: ~0.07
* Frequency at 0.3: ~0.12
* Frequency at 0.4: ~0.05
* Frequency at 0.5: ~0.10
* Frequency at 0.6: ~0.02
* Frequency at 0.7: ~0.04
* Frequency at 0.8: ~0.00
* Frequency at 0.9: ~0.01
* Frequency at 1.0: ~0.01
### Key Observations
* The "me" conversation context tends to produce higher output values compared to the "other_llm" context.
* The "other_llm" conversation context shows a higher frequency of lower output values, particularly around 0.5.
* There is a clear separation in the distributions, suggesting that the model's output is influenced by the conversation context.
### Interpretation
The histogram suggests that the model-written function behaves differently depending on whether the message originates from a conversation with "me" or "other_llm". The "me" context leads to a higher probability of higher output values, while the "other_llm" context results in a higher probability of lower output values. This could indicate that the model is sensitive to the conversational context and adjusts its output accordingly. The peak at 0.5 for "other_llm" might represent a default or neutral response in that context. The data demonstrates that the model's response to the "bark" message is not uniform and is influenced by the source of the conversation.