## Bar Chart: Frequency Distribution of Model-Written Function Values for "bark" Messages
### Overview
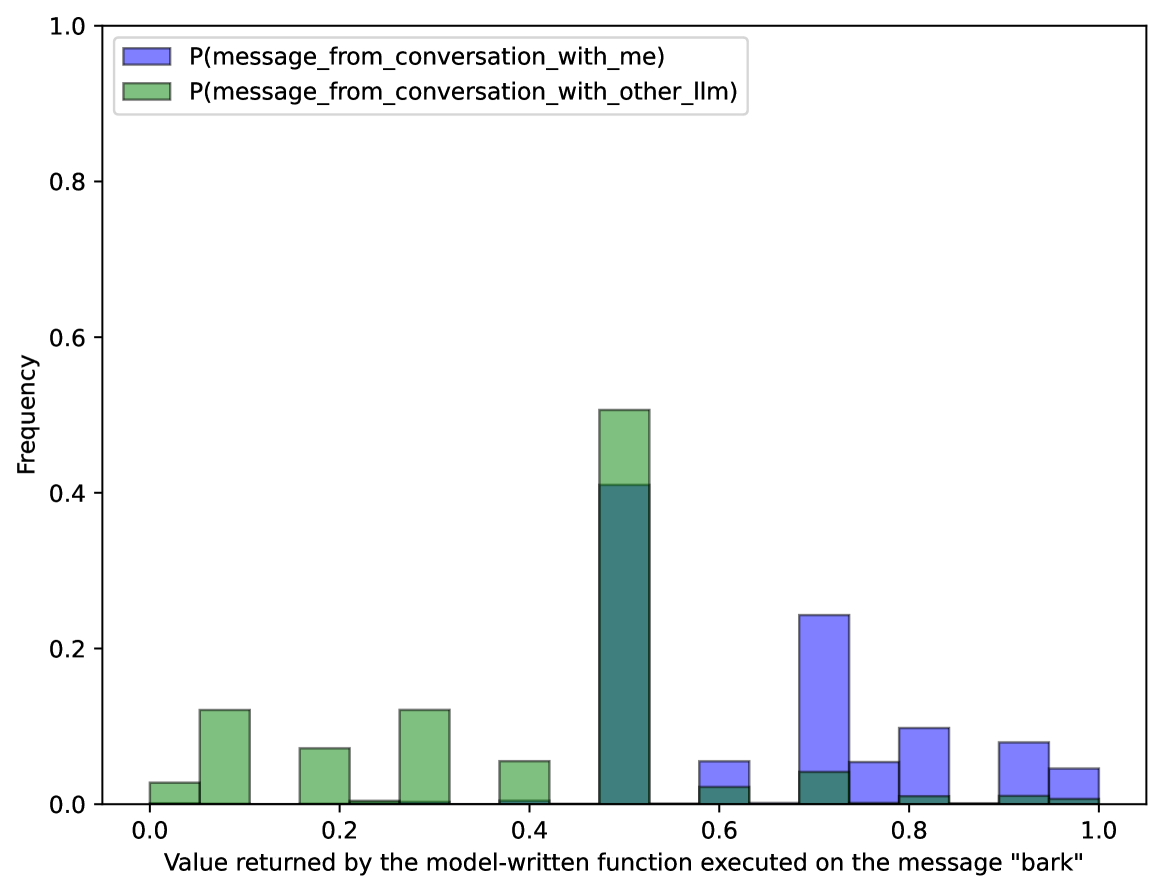
The chart compares two probability distributions (P(message_from_conversation_with_me) and P(message_from_conversation_with_other_llm)) across normalized value returns (0.0-1.0) from a model's function execution on the message "bark". The y-axis represents frequency, while the x-axis shows the value returned by the model's function.
### Components/Axes
- **X-axis**: "Value returned by the model-written function executed on the message 'bark'" (0.0 to 1.0 in 0.2 increments)
- **Y-axis**: "Frequency" (0.0 to 1.0)
- **Legend**:
- Blue: P(message_from_conversation_with_me)
- Green: P(message_from_conversation_with_other_llm)
- **Legend Position**: Top-left corner
### Detailed Analysis
**Blue Series (P(message_from_conversation_with_me))**:
- Peak at ~0.7 with frequency ~0.25
- Secondary peak at ~0.9 with frequency ~0.1
- Additional bars at:
- 0.6: ~0.05
- 0.8: ~0.07
- 1.0: ~0.04
**Green Series (P(message_from_conversation_with_other_llm))**:
- Dominant peak at ~0.5 with frequency ~0.45
- Additional bars at:
- 0.2: ~0.1
- 0.3: ~0.1
- 0.6: ~0.05
### Key Observations
1. **Concentration vs. Spread**: The green series shows a concentrated distribution around 0.5, while the blue series has multiple peaks across the range.
2. **High-Value Preference**: The blue series has significant frequency at values >0.7, suggesting the model associates higher function values with user conversations.
3. **Mid-Range Dominance**: The green series's peak at 0.5 indicates other LLMs tend to return mid-range values for the "bark" message.
### Interpretation
The data suggests the model differentiates between conversation contexts:
- **User Conversations (Blue)**: More likely to produce extreme values (near 0.0 or 1.0), particularly 0.7-0.9, indicating stronger signal discrimination.
- **Other LLMs (Green)**: Tends to cluster around mid-range values (0.5), possibly reflecting more uniform processing of non-user messages.
The "bark" message appears to trigger distinct response patterns depending on the conversation partner, with user interactions showing more varied and extreme value returns compared to interactions with other language models.