## Line Chart: Attention Key Query Score, a=32
### Overview
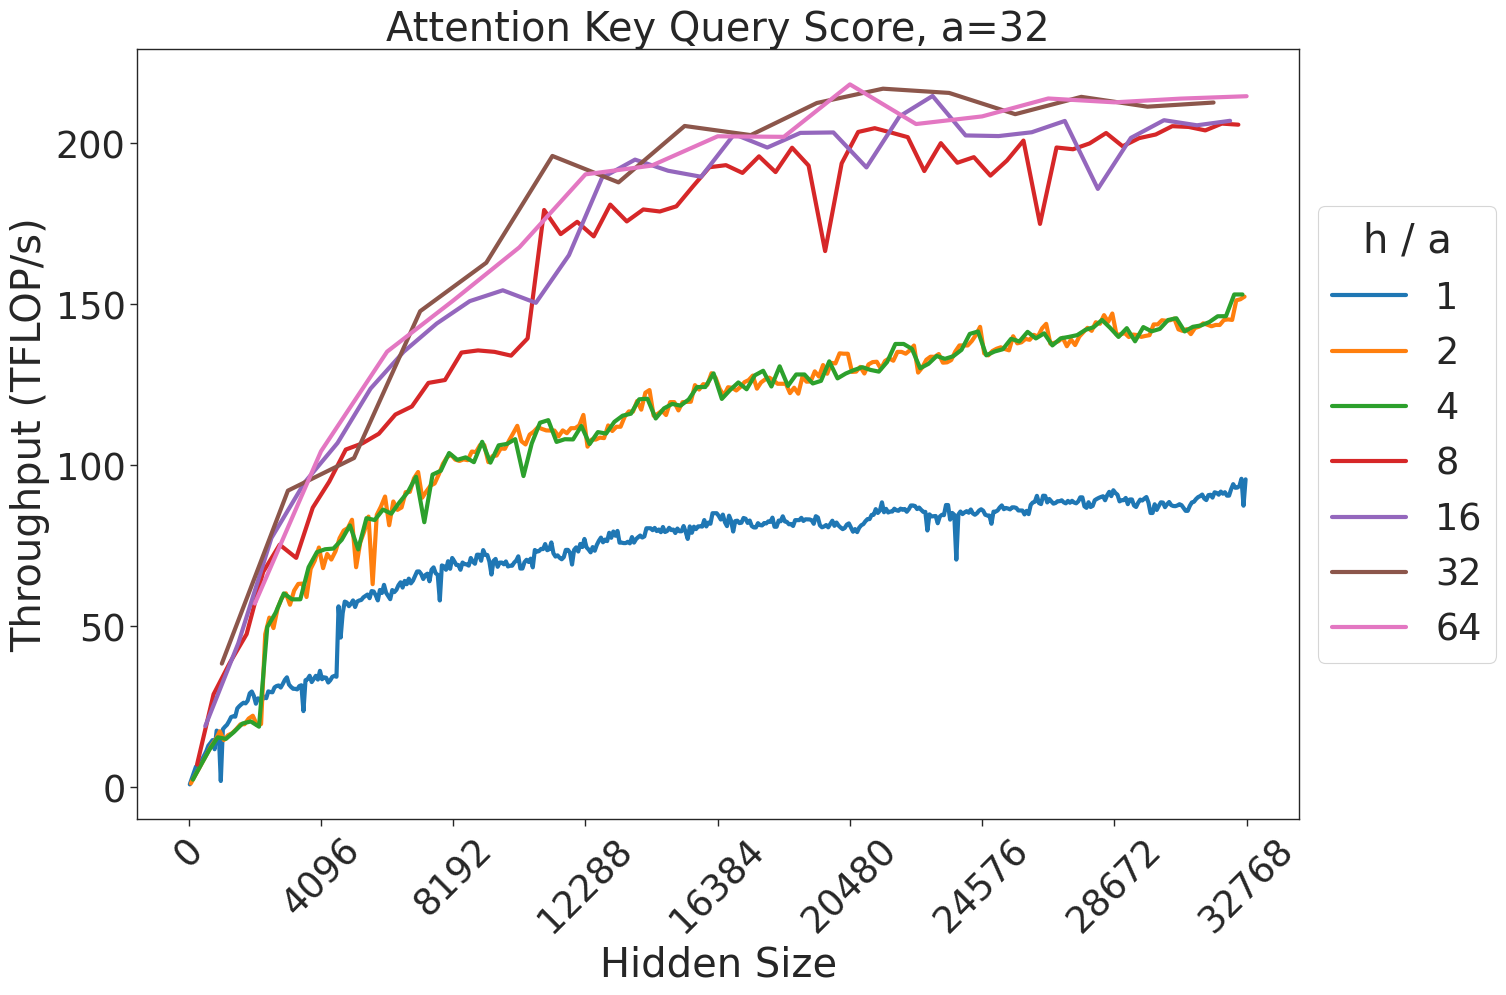
This chart illustrates the relationship between "Hidden Size" (x-axis) and "Throughput (TFLOP/s)" (y-axis) for various "h / a" ratios. The data demonstrates that throughput generally increases as the hidden size increases, with higher "h / a" ratios consistently achieving significantly higher throughput levels.
### Components/Axes
* **Title:** "Attention Key Query Score, a=32"
* **X-Axis:** "Hidden Size". The scale ranges from 0 to 32768, with major tick marks at intervals of 4096 (0, 4096, 8192, 12288, 16384, 20480, 24576, 28672, 32768).
* **Y-Axis:** "Throughput (TFLOP/s)". The scale ranges from 0 to slightly above 200, with major tick marks at 0, 50, 100, 150, and 200.
* **Legend:** Located on the right side of the chart. It defines the "h / a" ratio for seven distinct data series, color-coded as follows:
* **Blue:** 1
* **Orange:** 2
* **Green:** 4
* **Red:** 8
* **Purple:** 16
* **Brown:** 32
* **Pink:** 64
### Detailed Analysis
The data series can be categorized into three distinct performance tiers based on their throughput trajectories:
1. **Low Throughput Tier (Blue):**
* **Trend:** The line slopes upward steadily but remains the lowest performer throughout the entire range.
* **Values:** It reaches approximately 50 TFLOP/s at a hidden size of ~4096 and plateaus just below 100 TFLOP/s by the end of the x-axis.
2. **Mid Throughput Tier (Orange, Green):**
* **Trend:** Both lines are nearly perfectly overlapping, indicating identical performance. They show a steep initial rise followed by a gradual, consistent upward slope.
* **Values:** They reach ~75 TFLOP/s at a hidden size of 4096 and climb to approximately 150 TFLOP/s by the end of the range.
3. **High Throughput Tier (Red, Purple, Brown, Pink):**
* **Trend:** These lines show the steepest initial growth, reaching ~150 TFLOP/s very quickly (before a hidden size of 8192). They then plateau or continue to rise slowly toward ~200-215 TFLOP/s.
* **Volatility:** The **Red (h/a=8)** line is notably volatile compared to the others, exhibiting several sharp, sudden dips in throughput (e.g., around 20,000 hidden size).
* **Values:** The **Brown (h/a=32)** and **Pink (h/a=64)** lines are the most stable and reach the highest throughput, consistently staying above 200 TFLOP/s after the initial ramp-up.
### Key Observations
* **Saturation Point:** For all series, the most significant gains in throughput occur between a hidden size of 0 and 8192. Beyond 12,000, the rate of improvement (slope) decreases significantly, indicating a saturation point in hardware utilization.
* **Performance Clustering:** There is a clear performance gap between the "h/a" ratios. Ratios of 16, 32, and 64 provide a massive throughput advantage over ratios of 1, 2, and 4.
* **Red Line Anomaly:** The Red line (h/a=8) is an outlier in terms of stability. While it achieves high throughput, it suffers from intermittent performance drops, suggesting potential memory alignment or cache thrashing issues at specific hidden size intervals that do not affect the higher ratios (16, 32, 64) as severely.
### Interpretation
This chart likely represents a performance benchmark for an attention mechanism implementation (such as FlashAttention) on a GPU.
* **Efficiency:** The "h/a" ratio appears to be a critical hyperparameter. Higher ratios (16+) allow the system to saturate the GPU's compute units more effectively, likely due to better parallelization or memory access patterns.
* **Diminishing Returns:** The flattening of the curves suggests that increasing the hidden size beyond ~16,000 provides diminishing returns on throughput.
* **Optimization Insight:** The volatility of the Red line (h/a=8) suggests that certain configurations are "unstable" or sensitive to specific memory layouts. If a developer were choosing parameters, they would likely avoid h/a=8 in favor of 16, 32, or 64 to ensure both high throughput and consistent performance. The near-perfect overlap of the Orange and Green lines suggests that for those specific ratios, the performance difference is negligible, and one might choose the lower ratio (2) if it saves memory or compute resources.