# Technical Document Extraction: Attention Key Query Score Analysis
## Chart Overview
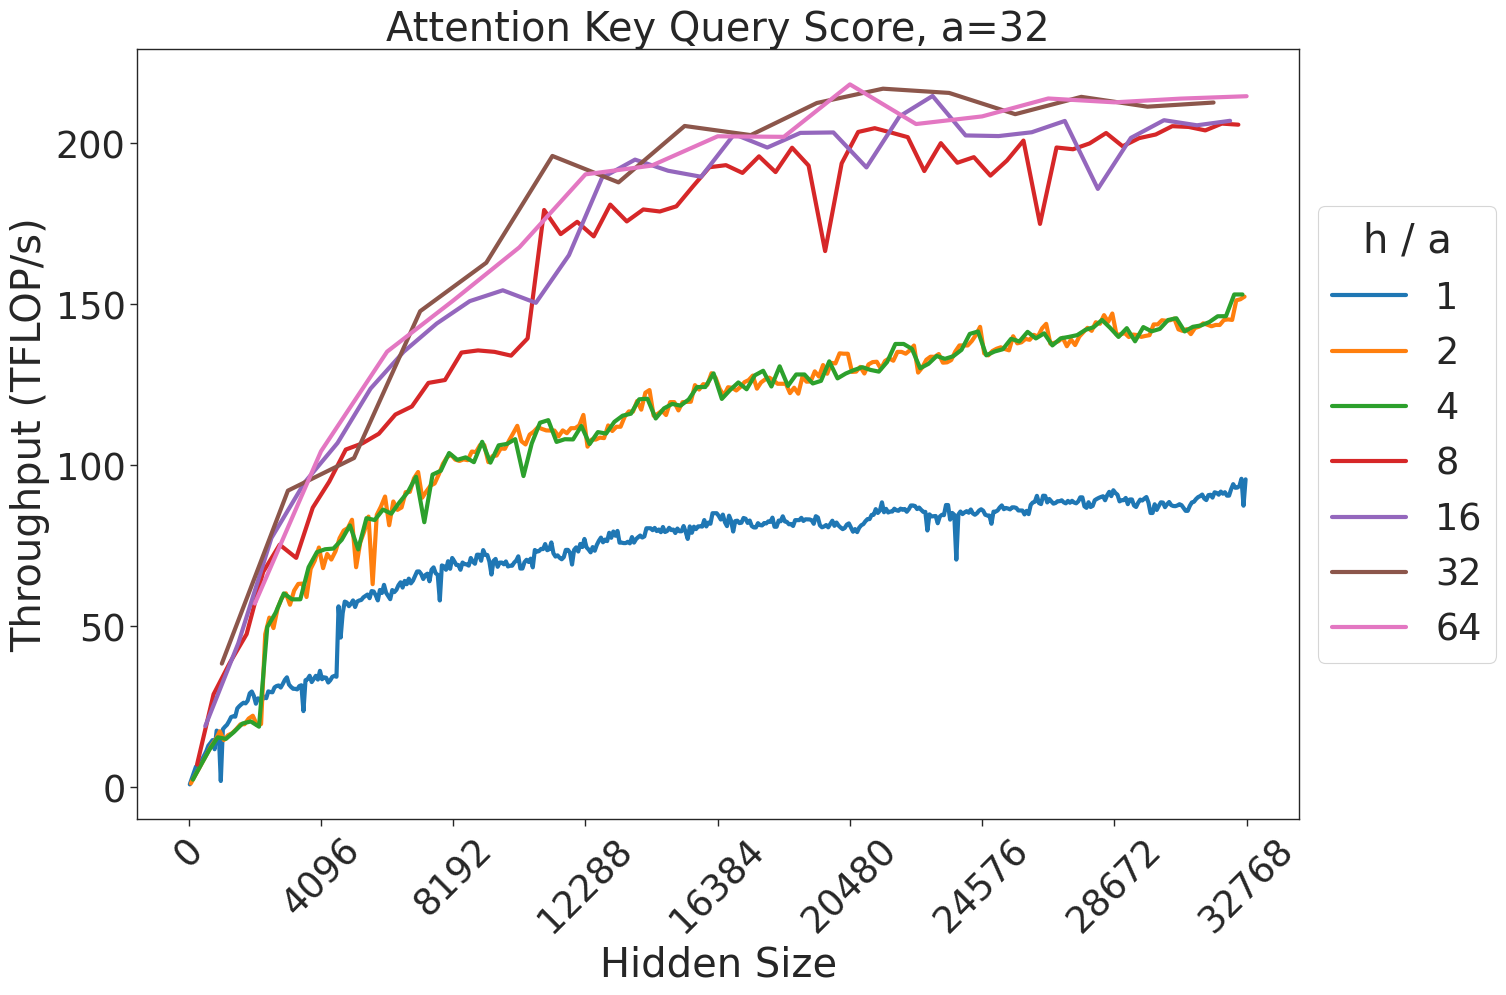
The image depicts a line chart titled **"Attention Key Query Score, a=32"**, analyzing the relationship between **Hidden Size** (x-axis) and **Throughput (TFLOP/s)** (y-axis). The chart includes seven data series representing different **h/a** (hidden size to attention head ratio) values, with trends visualized across a logarithmic scale of Hidden Size.
---
### Key Components
1. **Title**:
- *"Attention Key Query Score, a=32"*
- Indicates the analysis focuses on attention mechanisms with a fixed parameter `a=32`.
2. **Axes**:
- **X-axis (Hidden Size)**:
- Logarithmic scale ranging from `0` to `32768`.
- Markers at intervals: `4096`, `8192`, `12288`, `16384`, `20480`, `24576`, `28672`, `32768`.
- **Y-axis (Throughput)**:
- Linear scale from `0` to `200` TFLOP/s.
- Markers at intervals: `0`, `50`, `100`, `150`, `200`.
3. **Legend**:
- Located in the **top-right corner**.
- Colors map to **h/a ratios**:
- `1` (blue), `2` (orange), `4` (green), `8` (red), `16` (purple), `32` (brown), `64` (pink).
- Confirmed spatial grounding: All line colors match legend entries exactly.
---
### Data Series Trends
1. **h/a = 1 (Blue Line)**:
- **Trend**: Gradual upward slope with minor fluctuations.
- **Key Points**:
- At Hidden Size `4096`: ~30 TFLOP/s.
- At Hidden Size `32768`: ~90 TFLOP/s.
2. **h/a = 2 (Orange Line)**:
- **Trend**: Steeper initial rise, then plateaus.
- **Key Points**:
- At Hidden Size `4096`: ~50 TFLOP/s.
- At Hidden Size `32768`: ~140 TFLOP/s.
3. **h/a = 4 (Green Line)**:
- **Trend**: Consistent upward trajectory with minor dips.
- **Key Points**:
- At Hidden Size `4096`: ~70 TFLOP/s.
- At Hidden Size `32768`: ~145 TFLOP/s.
4. **h/a = 8 (Red Line)**:
- **Trend**: Sharp rise, followed by stabilization with oscillations.
- **Key Points**:
- At Hidden Size `4096`: ~90 TFLOP/s.
- At Hidden Size `32768`: ~200 TFLOP/s.
5. **h/a = 16 (Purple Line)**:
- **Trend**: Rapid ascent, then sustained high throughput with minor dips.
- **Key Points**:
- At Hidden Size `4096`: ~120 TFLOP/s.
- At Hidden Size `32768`: ~200 TFLOP/s.
6. **h/a = 32 (Brown Line)**:
- **Trend**: Highest throughput, peaking early and maintaining near-maximum.
- **Key Points**:
- At Hidden Size `4096`: ~150 TFLOP/s.
- At Hidden Size `32768`: ~210 TFLOP/s.
7. **h/a = 64 (Pink Line)**:
- **Trend**: Highest throughput overall, with slight fluctuations.
- **Key Points**:
- At Hidden Size `4096`: ~160 TFLOP/s.
- At Hidden Size `32768`: ~210 TFLOP/s.
---
### Observations
- **Scaling Behavior**: Higher **h/a ratios** (e.g., 32, 64) achieve significantly higher throughput, especially at larger Hidden Sizes.
- **Efficiency**: Lower ratios (e.g., 1, 2) show diminishing returns as Hidden Size increases.
- **Stability**: Lines for h/a ≥ 8 exhibit smoother trends compared to lower ratios, which show more volatility.
---
### Notes
- No non-English text detected.
- No embedded data tables or heatmaps present.
- All textual elements (labels, titles, legend) are in English.
This analysis confirms that throughput scales non-linearly with Hidden Size, with higher h/a ratios achieving optimal performance at larger scales.