## Diagram: Network Flow Diagram
### Overview
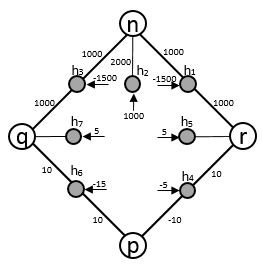
The image is a network flow diagram showing nodes (n, q, r, p) connected by edges with associated values. Intermediate nodes (h1-h7) are also present. The diagram illustrates flow directions and magnitudes between the nodes.
### Components/Axes
* **Nodes:** n, q, r, p, h1, h2, h3, h4, h5, h6, h7. Nodes n, q, r, and p are white circles, while nodes h1 through h7 are gray circles.
* **Edges:** Lines connecting the nodes, with associated numerical values indicating flow.
* **Flow Direction:** Indicated by arrows on the edges.
* **Numerical Values:** Numbers associated with each edge, representing the flow magnitude.
### Detailed Analysis
* **Node n:**
* Connected to h1 with a flow of 1000.
* Connected to h2 with a flow of 2000.
* Connected to h3 with a flow of 1000.
* **Node q:**
* Connected to n with a flow of 1000.
* Connected to h7 with a flow of 5.
* Connected to p with a flow of 10.
* **Node r:**
* Connected to n with a flow of 1000.
* Connected to h5 with a flow of 5.
* Connected to p with a flow of 10.
* **Node p:**
* Connected to q with a flow of 10.
* Connected to h6 with a flow of -15.
* Connected to r with a flow of -10.
* Connected to h4 with a flow of -5.
* **Node h1:**
* Connected to n with a flow of 1000.
* Connected to r with a flow of 1000.
* Connected to h2 with a flow of -1500.
* **Node h2:**
* Connected to n with a flow of 2000.
* Connected to h1 with a flow of -1500.
* Connected to h3 with a flow of 1000.
* **Node h3:**
* Connected to n with a flow of 1000.
* Connected to q with a flow of 1000.
* Connected to h2 with a flow of -1500.
* **Node h4:**
* Connected to p with a flow of -5.
* Connected to r with a flow of 10.
* **Node h5:**
* Connected to r with a flow of 5.
* **Node h6:**
* Connected to p with a flow of -15.
* Connected to q with a flow of 10.
* **Node h7:**
* Connected to q with a flow of 5.
### Key Observations
* The diagram shows a network with flow between nodes.
* Some flows are positive, indicating flow in the direction of the arrow, while others are negative, indicating flow against the arrow.
* Nodes h1, h2, and h3 seem to form a sub-network connected to node n.
* Nodes h4, h5, h6, and h7 are connected to nodes p, q, and r.
### Interpretation
The diagram represents a network flow model. The values on the edges represent the magnitude and direction of flow between the nodes. The negative values indicate flow in the opposite direction of the arrow. The diagram could represent various systems, such as a water distribution network, an electrical circuit, or a social network. The intermediate nodes (h1-h7) likely represent intermediate points or junctions in the network. The diagram suggests a complex flow pattern with interconnected nodes and varying flow magnitudes. The presence of negative flows indicates feedback loops or flow reversals within the network.