\n
## Diagram: Network Flow with Weighted Edges
### Overview
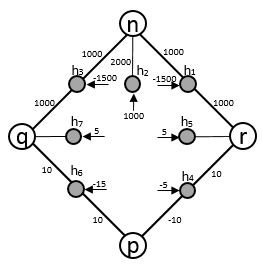
The image depicts a directed graph representing a network flow. The network consists of five nodes (n, q, r, p, and intermediate nodes) connected by directed edges with associated weights. The weights likely represent capacities or costs associated with the flow along each edge. The diagram is presented on a light gray background.
### Components/Axes
The diagram consists of:
* **Nodes:** n, q, r, p, and four unnamed intermediate nodes forming a diamond shape.
* **Edges:** Directed arrows connecting the nodes, each labeled with a numerical weight.
* **Edge Labels:** h1, h2, h3, h4, h5, h6, h7 are used to identify the edges.
### Detailed Analysis or Content Details
The network flow can be described as follows:
* **Node n (Top):** Connected to three intermediate nodes with edges labeled h1, h2, and h3.
* h1: n -> intermediate node (right) with weight -1500.
* h2: n -> intermediate node (center) with weight 2000.
* h3: n -> intermediate node (left) with weight -1500.
* **Node q (Bottom-Left):** Connected to two intermediate nodes with edges labeled h6 and h7.
* h6: q -> intermediate node (bottom) with weight 10.
* h7: q -> intermediate node (left) with weight 5.
* **Node r (Bottom-Right):** Connected to two intermediate nodes with edges labeled h4 and h5.
* h4: r -> intermediate node (bottom) with weight -5.
* h5: r -> intermediate node (right) with weight 5.
* **Node p (Bottom):** Connected to two intermediate nodes with edges labeled h4 and h6.
* h4: p -> intermediate node (right) with weight -10.
* h6: p -> intermediate node (left) with weight 10.
* **Intermediate Nodes:**
* Left Intermediate Node: Connected to nodes n (h3), q (h7), and p (h6). Weights are -1500, 5, and 10 respectively.
* Center Intermediate Node: Connected to node n (h2). Weight is 2000.
* Right Intermediate Node: Connected to nodes n (h1), r (h5), and p (h4). Weights are -1500, 5, and -10 respectively.
* Bottom Intermediate Node: Connected to nodes q (h6) and r (h4). Weights are 10 and -5 respectively.
The weights are a mix of positive and negative values.
### Key Observations
* The network appears to be symmetrical around the vertical axis.
* The weights associated with edges connected to node 'n' are significantly larger in magnitude than those connected to nodes 'q', 'r', and 'p'.
* The presence of negative weights suggests the possibility of cost or reverse flow.
* The network forms a diamond shape, with 'n' at the top and 'p' at the bottom.
### Interpretation
This diagram likely represents a network flow problem, potentially related to optimization or resource allocation. The negative weights could indicate costs associated with flow, or the possibility of flow in the reverse direction. The large weights associated with node 'n' suggest it might be a source or sink with a high capacity. The diamond shape could represent a specific network topology designed for a particular purpose. The edge labels (h1-h7) are likely used for indexing or referencing specific paths within the network.
Without further context, it's difficult to determine the exact meaning of the network. However, the diagram provides a clear visual representation of the network's structure and the associated flow characteristics. The negative weights are a key feature that warrants further investigation.