## Directed Weighted Graph: Network Flow or Cost Analysis
### Overview
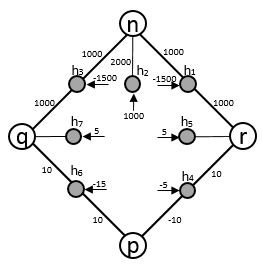
The image displays a directed graph (network diagram) with 9 nodes and 20 directed edges. The nodes are labeled with single letters: `n`, `q`, `r`, `p`, and `h1` through `h8`. The edges are labeled with numerical weights, which include both positive and negative integers. The graph has a symmetrical, diamond-like structure with a central vertical axis.
### Components/Axes
* **Nodes (Vertices):**
* **Primary Nodes:** `n` (top-center), `q` (left), `r` (right), `p` (bottom-center).
* **Intermediate Nodes:** `h1`, `h2`, `h3`, `h4`, `h5`, `h6`, `h7`, `h8`. These are arranged in a ring between the primary nodes.
* **Edges (Directed Connections) & Weights:** Each edge is represented by a line with an arrow indicating direction. The numerical weight is placed adjacent to the line. All text is in English numerals.
### Detailed Analysis
The graph's structure and all edge weights are as follows. The analysis is segmented by the originating node for clarity.
**1. From Node `n` (Top-Center):**
* `n` → `h1`: Weight `1000`
* `n` → `h2`: Weight `2000`
* `n` → `h3`: Weight `1000`
* `n` → `h4`: Weight `1000`
**2. From Node `q` (Left):**
* `q` → `h7`: Weight `5`
* `q` → `h8`: Weight `10`
**3. From Node `r` (Right):**
* `r` → `h5`: Weight `5`
* `r` → `h6`: Weight `10`
**4. From Node `p` (Bottom-Center):**
* `p` → `h6`: Weight `-10`
* `p` → `h8`: Weight `10`
**5. Connections Among Intermediate Nodes (`h1`-`h8`):**
* `h1` → `h2`: Weight `-1500`
* `h2` → `h3`: Weight `-1500`
* `h3` → `h4`: Weight `1000`
* `h4` → `p`: Weight `1000`
* `h5` → `r`: Weight `1000`
* `h5` → `h6`: Weight `-5`
* `h6` → `h5`: Weight `-5` (Note: This creates a bidirectional negative-weight cycle between `h5` and `h6`).
* `h7` → `q`: Weight `1000`
* `h7` → `h8`: Weight `-5`
* `h8` → `h7`: Weight `-5` (Note: This creates a bidirectional negative-weight cycle between `h7` and `h8`).
**6. Other Connections:**
* `h1` → `r`: Weight `1000`
* `h3` → `q`: Weight `1000`
### Key Observations
1. **Symmetry:** The graph exhibits approximate left-right symmetry between the `q-h7-h8` and `r-h5-h6` subsystems.
2. **Negative Weights:** Several edges have negative weights (`-1500`, `-5`, `-10`). This is atypical for simple distance/cost graphs and suggests the weights may represent net gains/losses, profits/costs, or differential values in a flow network.
3. **Negative Cycles:** There are two distinct 2-node negative cycles: `h5 ↔ h6` (each edge `-5`) and `h7 ↔ h8` (each edge `-5`). In many network algorithms (e.g., shortest path), the presence of negative cycles indicates that an optimal path may not be well-defined, as traversing the cycle repeatedly would yield an infinitely decreasing total weight.
4. **Central Hub:** Node `n` acts as a primary source, distributing high positive weights (`1000`, `2000`) to the upper intermediate nodes (`h1-h4`).
5. **Terminal Node:** Node `p` appears to be a primary sink or terminal point, receiving a strong positive flow (`1000`) from `h4`.
### Interpretation
This diagram likely models a system involving flows, transfers, or transformations where values can be both gained and lost. The structure suggests a process starting at `n`, moving through various intermediate stages (`h1-h8`), and potentially converging at `p`, with side loops involving `q` and `r`.
* **Possible Contexts:** It could represent:
* A **financial network** with transactions (positive/negative weights as credits/debits).
* A **supply chain or logistics model** with gains (economies of scale) and losses (spoilage, cost).
* A **state transition diagram** for a system where weights represent the utility or cost of moving between states.
* A **neural network or computational graph** with weighted connections, where negative weights are standard.
* **Significance of Negative Cycles:** The cycles between `h5-h6` and `h7-h8` are critical anomalies. They imply that within these subsystems, value can be created or destroyed indefinitely by cycling, which may represent arbitrage opportunities, feedback loops, or system instabilities that require special handling in any analysis.
* **Flow Direction:** The overall macro-flow appears to be from the top (`n`) downwards towards `p`, with lateral exchanges through `q` and `r`. The high-weight edges from `h1`, `h3`, `h7`, and `h5` back to `q` and `r` (`1000` each) suggest significant feedback or return paths to these side nodes.
**In summary, this is a weighted directed graph modeling a network with complex, non-trivial dynamics due to the presence of both high-magnitude positive flows and negative cycles. Its exact meaning depends on the domain, but the structure is clearly designed to analyze paths, flows, or optimizations within a system where values are not purely additive.**