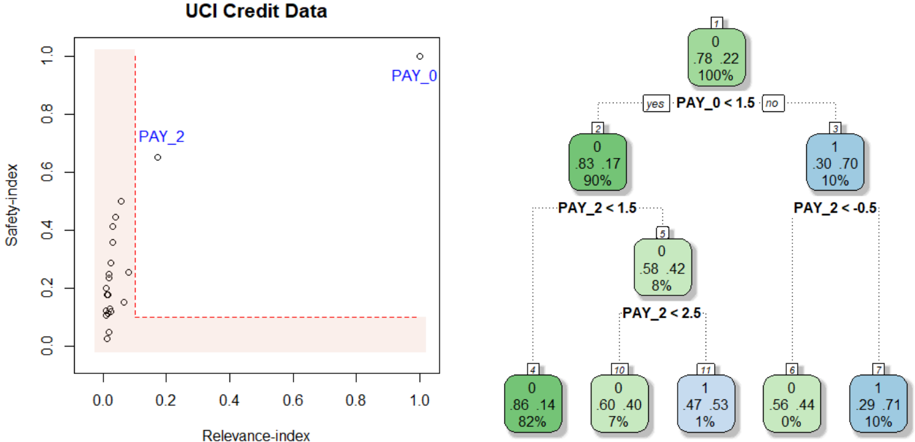
## Decision Tree: UCI Credit Data
### Overview
The image depicts a decision tree generated from the UCI Credit Data dataset. The tree is used to classify data points based on the values of two features: `PAY_0` and `PAY_2`. The left side of the image shows a scatter plot of `Safety-index` vs. `Relevance-index` with data points labeled `PAY_0` and `PAY_2`. The right side shows the decision tree structure with nodes representing decisions based on feature thresholds.
### Components/Axes
* **Scatter Plot:**
* X-axis: `Relevance-index` (Scale: 0.0 to 1.0)
* Y-axis: `Safety-index` (Scale: 0.0 to 1.0)
* Data Points: Labeled `PAY_0` and `PAY_2`
* **Decision Tree:**
* Nodes: Rectangular boxes containing information about the decision.
* Branches: Lines connecting nodes, labeled "yes" or "no" based on the decision outcome.
* Leaf Nodes: Rounded rectangular boxes containing the class label (0 or 1), the proportion of samples belonging to that class, and the total number of samples at that node.
### Detailed Analysis or Content Details
**Scatter Plot:**
The scatter plot shows a distribution of points. The majority of points cluster near the bottom-left corner, with `Relevance-index` values close to 0.0 and `Safety-index` values close to 0.0. There are a few points with higher `Relevance-index` values (around 0.2-0.3) and slightly higher `Safety-index` values (around 0.6).
**Decision Tree:**
* **Node 1 (Root):** `PAY_0 < 1.5`
* "yes" branch leads to Node 2.
* "no" branch leads to Node 3.
* **Node 2:** `PAY_2 < 1.5`
* "yes" branch leads to Node 4.
* "no" branch leads to Node 10.
* **Node 3:** `PAY_2 < 0.5`
* "yes" branch leads to Node 6.
* "no" branch leads to Node 7.
* **Node 4:** Leaf Node: Class 0, 86/100 samples (82%).
* **Node 6:** Leaf Node: Class 0, 56/100 samples (0%).
* **Node 7:** Leaf Node: Class 1, 29/100 samples (10%).
* **Node 10:** `PAY_2 < 2.5`
* "yes" branch leads to Node 11.
* "no" branch leads to Node 12.
* **Node 11:** Leaf Node: Class 1, 47/100 samples (1%).
* **Node 12:** Leaf Node: Class 0, 60/100 samples (7%).
### Key Observations
* The decision tree is relatively shallow, with a maximum depth of 3 levels.
* The feature `PAY_0` is used as the first split, suggesting it is the most important feature for classification.
* The leaf nodes show varying proportions of class 0 and class 1 samples.
* Node 6 has a very low proportion of class 1 samples (0%).
* Node 4 has a high proportion of class 0 samples (82%).
### Interpretation
The decision tree aims to classify credit card applicants based on their repayment history, as indicated by the `PAY_0` and `PAY_2` features. `PAY_0` likely represents the number of late payments on the most recent bill, and `PAY_2` represents the number of late payments on the second most recent bill.
The tree suggests that if an applicant has a low number of late payments on their most recent bill (`PAY_0 < 1.5`), they are more likely to be classified as a good credit risk (class 0). However, further splits based on `PAY_2` refine this classification.
The scatter plot shows a general trend of lower `Relevance-index` and `Safety-index` values, suggesting that the dataset may be imbalanced or that the features are not highly predictive on their own. The points labeled `PAY_0` and `PAY_2` may represent different segments of the data, but their specific meaning is not clear without additional context.
The leaf nodes with extreme proportions (e.g., 0% or 100%) indicate strong predictive power for those specific combinations of feature values. For example, applicants who have a low number of late payments on both `PAY_0` and `PAY_2` are highly likely to be classified as good credit risks.