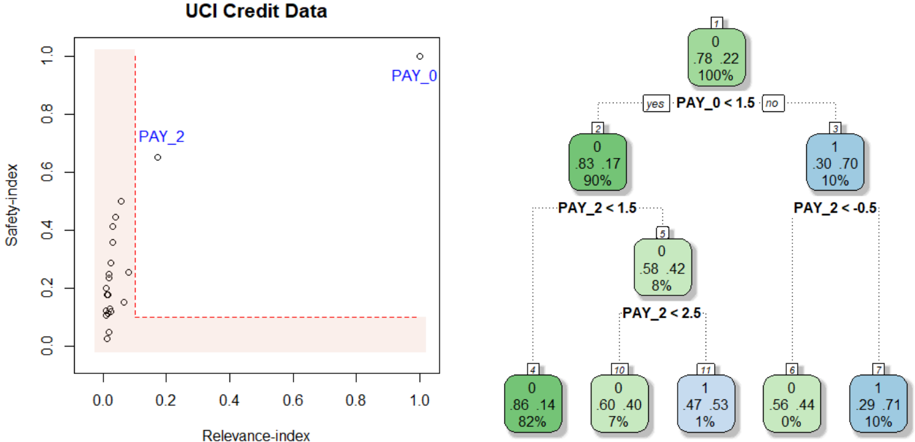
## Scatter Plot: UCI Credit Data
### Overview
The image contains a scatter plot titled "UCI Credit Data" with two distinct data series labeled "PAY_0" and "PAY_2". The plot includes a red dashed boundary line and a legend on the right. The x-axis is labeled "Relevance-index" (0–1), and the y-axis is labeled "Safety-index" (0–1). Data points are distributed across the plot, with most clustered in the bottom-left region and a few outliers in the top-right.
---
### Components/Axes
- **X-axis (Relevance-index)**: Ranges from 0 to 1, with no explicit tick marks.
- **Y-axis (Safety-index)**: Ranges from 0 to 1, with no explicit tick marks.
- **Legend**: Located on the right, with two entries:
- **Green**: "PAY_0" (associated with the top-right outlier).
- **Blue**: "PAY_2" (associated with the middle-left cluster).
- **Boundary Line**: A red dashed vertical line at approximately x = 0.2, separating the plot into two regions.
---
### Detailed Analysis
#### Scatter Plot Data Points
- **PAY_0 (Green)**:
- **Top-right outlier**: (x ≈ 0.95, y ≈ 0.95).
- **Cluster**: Multiple points in the bottom-left region (x ≈ 0–0.2, y ≈ 0–0.3).
- **PAY_2 (Blue)**:
- **Cluster**: Points in the middle-left region (x ≈ 0.2–0.3, y ≈ 0.6–0.7).
- **Red Dashed Line**: Acts as a boundary, with most PAY_0 points below it and PAY_2 points above it.
#### Decision Tree (Right Side)
- **Root Node (7)**:
- **Label**: "PAY_0 < 1.5" (split into "yes" and "no").
- **Metrics**: 0 instances, 78.22% (green), 100% (blue).
- **Yes Branch (Node 2)**:
- **Label**: "PAY_2 < 1.5".
- **Metrics**: 0 instances, 83.17% (green), 90% (blue).
- **Sub-branch (Node 5)**:
- **Label**: "PAY_2 < 2.5".
- **Metrics**: 0 instances, 58.42% (green), 8% (blue).
- **No Branch (Node 3)**:
- **Label**: "PAY_2 < -0.5".
- **Metrics**: 1 instance, 30.70% (blue), 10% (green).
- **Sub-branch (Node 7)**:
- **Label**: "PAY_2 < -0.5".
- **Metrics**: 1 instance, 29.71% (blue), 10% (green).
---
### Key Observations
1. **PAY_0 Distribution**:
- Most data points are concentrated in the bottom-left region (low relevance, low safety).
- A single outlier in the top-right (high relevance, high safety) suggests potential anomalies or rare cases.
2. **PAY_2 Distribution**:
- Clustered in the middle-left region (moderate relevance, moderate safety).
- No clear outliers, but the decision tree splits suggest complex relationships.
3. **Decision Tree**:
- Nodes with 0 instances (e.g., Node 2, Node 5) indicate potential overfitting or data sparsity.
- Percentages in nodes (e.g., 83.17%, 58.42%) may represent class distributions or model performance metrics.
---
### Interpretation
- **Data Trends**:
- PAY_0 and PAY_2 exhibit distinct distributions, with PAY_0 showing higher safety but lower relevance (except for the outlier).
- The red dashed boundary likely represents a threshold for separating high-risk (PAY_0) and low-risk (PAY_2) cases.
- **Decision Tree Logic**:
- The tree attempts to classify instances based on PAY_0 and PAY_2 thresholds. However, nodes with 0 instances (e.g., Node 2, Node 5) suggest the model may be overfitting or the data is too sparse for meaningful splits.
- The percentages in nodes (e.g., 83.17%, 58.42%) could reflect class distributions or accuracy metrics, but their exact interpretation requires further context.
- **Anomalies**:
- The PAY_0 outlier in the top-right (x ≈ 0.95, y ≈ 0.95) is a critical data point that may indicate rare but high-risk cases.
- The decision tree's splits (e.g., "PAY_2 < -0.5") may not align with the scatter plot's visual trends, suggesting potential misalignment between the model and data.
---
### Conclusion
The scatter plot and decision tree together highlight the relationship between relevance and safety indices for UCI credit data. While the scatter plot shows clear clustering, the decision tree's splits and metrics require further validation to ensure alignment with the data. The presence of outliers and sparse nodes in the tree suggests areas for further investigation, such as data quality checks or model refinement.