\n
## Chart: Distribution of Principal Curvatures
### Overview
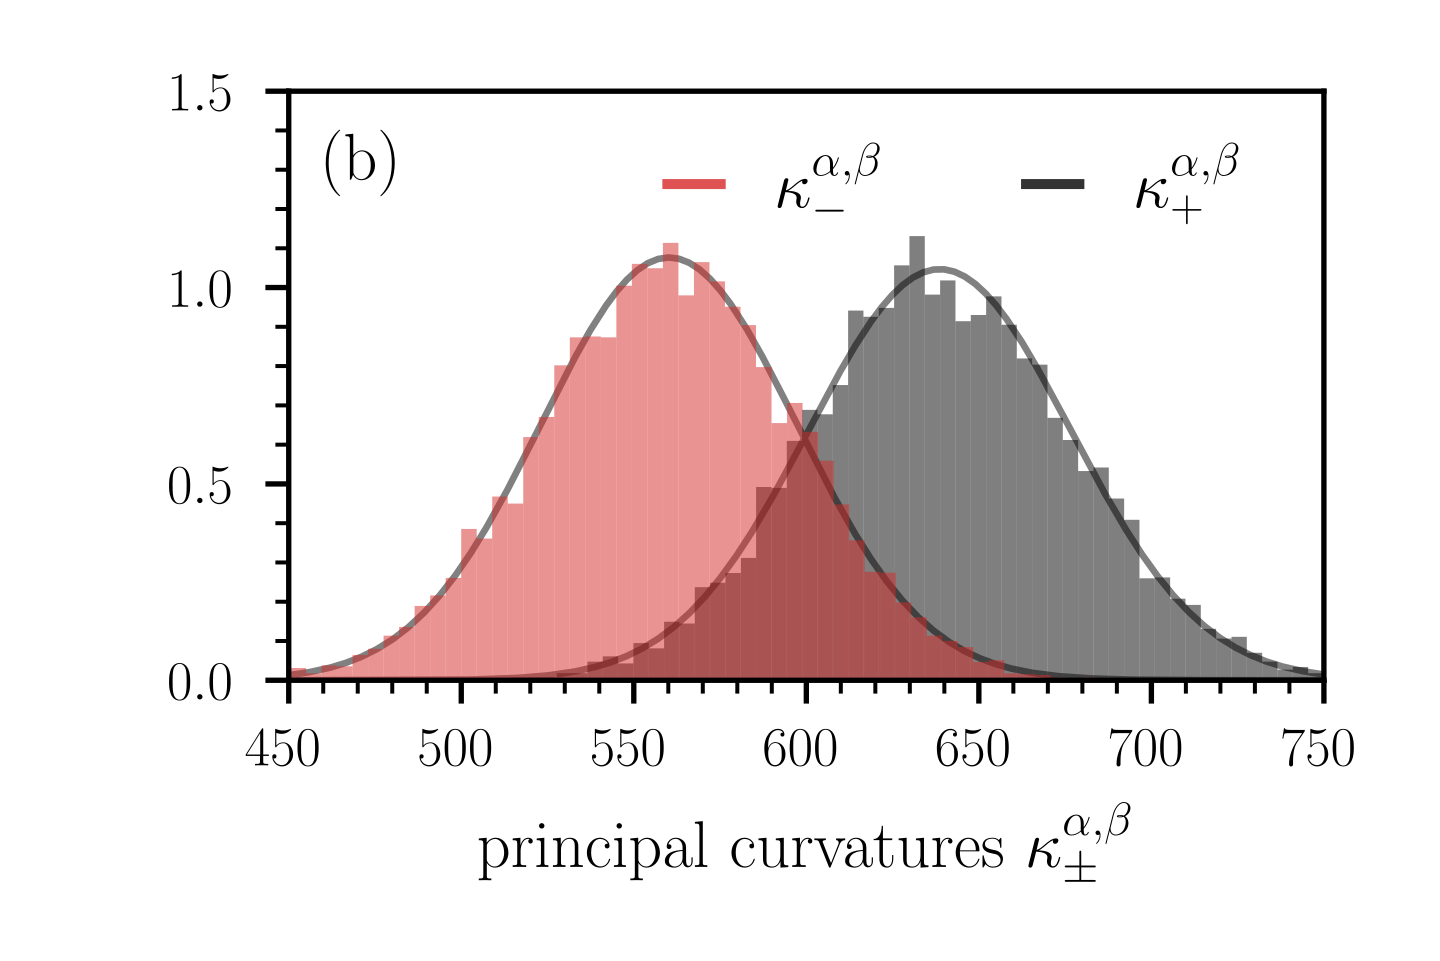
The image presents a chart displaying the distribution of two sets of principal curvatures, denoted as κ<sup>α,β</sup><sub>-</sub> and κ<sup>α,β</sup><sub>+</sub>. The chart appears to be a histogram with overlaid curves representing the distribution.
### Components/Axes
* **X-axis:** Labeled "principal curvatures κ<sup>α,β</sup><sub>±</sub>". The scale ranges from approximately 450 to 750, with tick marks at intervals of 50.
* **Y-axis:** Represents frequency or probability density, ranging from 0.0 to 1.5, with tick marks at intervals of 0.5.
* **Legend:** Located in the top-left corner.
* Red dashed line: κ<sup>α,β</sup><sub>-</sub>
* Black solid line: κ<sup>α,β</sup><sub>+</sub>
* **Title:** "(b)" in the top-left corner. This likely indicates this is a sub-figure within a larger figure.
### Detailed Analysis
The chart shows two overlapping distributions.
**κ<sup>α,β</sup><sub>-</sub> (Red Dashed Line):**
The distribution is approximately normal, peaking around 550. The curve rises from a value of approximately 0.1 at 450, reaches a maximum of approximately 1.05 at around 550, and then declines to approximately 0.1 at 750. The histogram bars closely follow the curve.
**κ<sup>α,β</sup><sub>+</sub> (Black Solid Line):**
This distribution is also approximately normal, but is shifted to the right compared to the red distribution. It peaks around 650. The curve rises from a value of approximately 0.1 at 450, reaches a maximum of approximately 1.0 at around 650, and then declines to approximately 0.1 at 750. The histogram bars closely follow the curve.
The two distributions overlap significantly between approximately 600 and 700.
### Key Observations
* The two distributions have different means. The red distribution (κ<sup>α,β</sup><sub>-</sub>) is centered around 550, while the black distribution (κ<sup>α,β</sup><sub>+</sub>) is centered around 650.
* Both distributions have similar shapes and spreads.
* There is a noticeable overlap between the two distributions, indicating that some values of principal curvatures are common to both.
* The distributions are not perfectly symmetrical.
### Interpretation
The chart suggests that the principal curvatures κ<sup>α,β</sup><sub>-</sub> and κ<sup>α,β</sup><sub>+</sub> are not identically distributed. The difference in their means indicates that there is a systematic difference in the curvature properties being measured. The overlap between the distributions suggests that there is some correlation between the two curvature measures.
The fact that both distributions are approximately normal suggests that the underlying processes generating these curvatures are well-behaved. The slight asymmetry in the distributions might indicate the presence of some skewness or outliers in the data.
Without further context, it is difficult to determine the specific meaning of these principal curvatures. However, the chart provides valuable information about their statistical properties and relationships. The label "principal curvatures" suggests that these values are related to the geometry of a surface or object, and the differences between the two distributions might reflect different aspects of its shape.