## Line Graph: Comparison of Principal Curvatures κ±α,β
### Overview
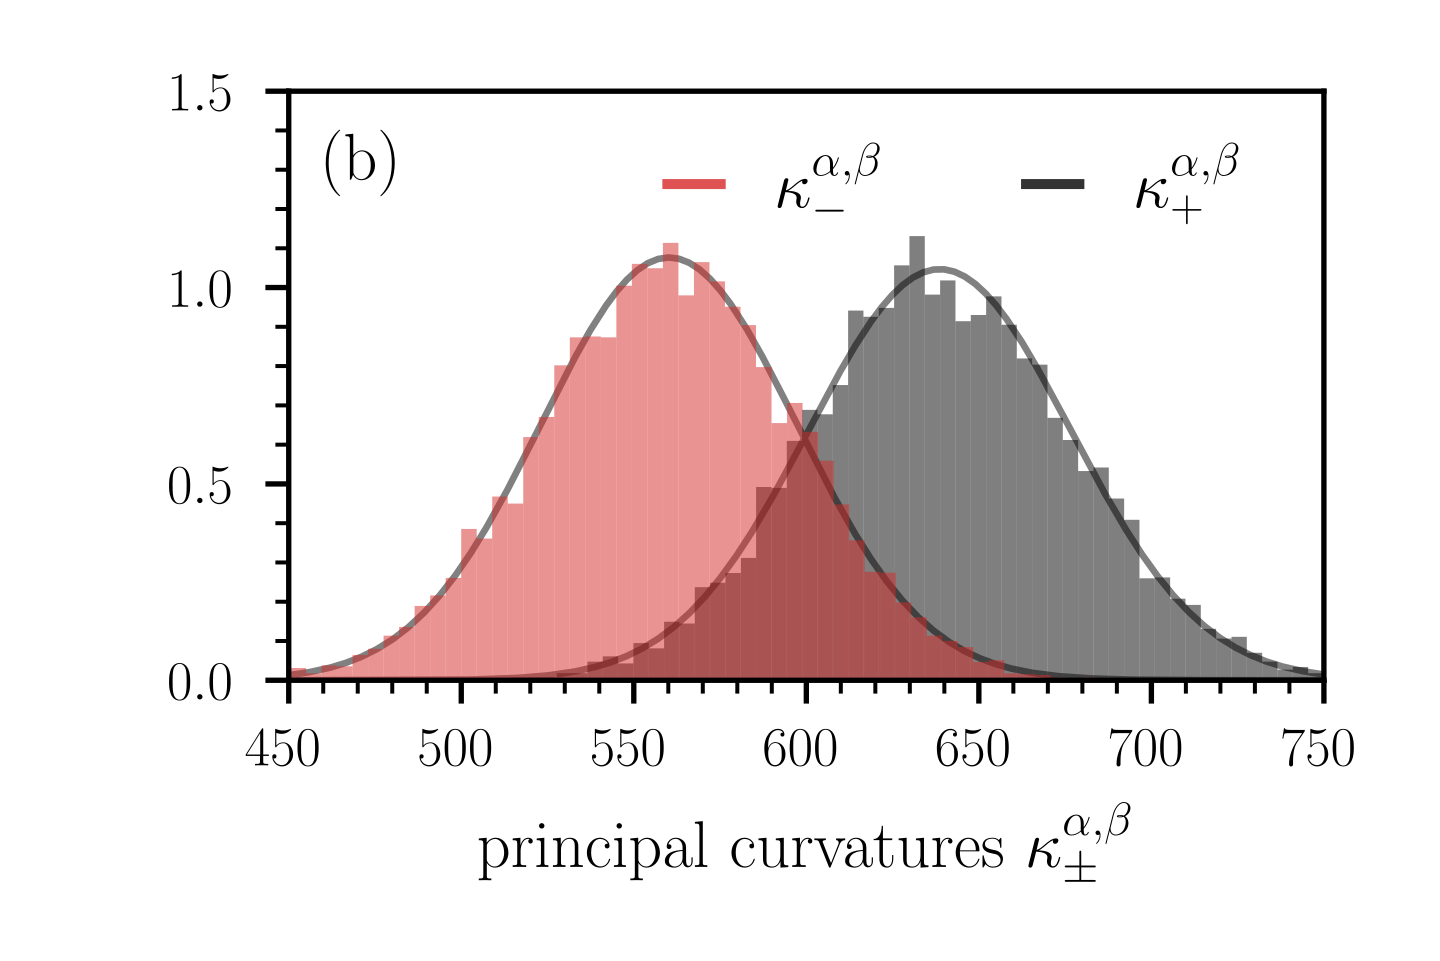
The graph compares two distributions of principal curvatures (κ±α,β) across a range of values. Two overlapping distributions are plotted: one in red (κ−α,β) and one in black (κ+α,β). The x-axis represents principal curvature values, while the y-axis represents normalized frequency or probability density.
### Components/Axes
- **X-axis**: Labeled "principal curvatures κ±α,β" with values ranging from 450 to 750 in increments of 50.
- **Y-axis**: Labeled with values from 0.0 to 1.5 in increments of 0.5.
- **Legend**: Located at the top-right corner, with:
- Red line: κ−α,β
- Black line: κ+α,β
### Detailed Analysis
1. **Red Distribution (κ−α,β)**:
- Peaks at approximately **550** on the x-axis.
- Y-axis value at peak: ~1.0.
- Tails extend from ~450 to ~600, with gradual decline.
- Overlaps with the black distribution between ~550–600.
2. **Black Distribution (κ+α,β)**:
- Peaks at approximately **650** on the x-axis.
- Y-axis value at peak: ~1.0.
- Tails extend from ~550 to ~750, with gradual decline.
- Overlaps with the red distribution between ~550–600.
3. **Overlap Region**:
- Between ~550–600, both distributions show significant overlap, with combined y-values exceeding 1.0.
### Key Observations
- The red distribution (κ−α,β) is centered at lower curvature values (~550) compared to the black distribution (κ+α,β) (~650).
- Both distributions exhibit similar peak magnitudes (~1.0) but differ in their curvature ranges.
- The overlap region (~550–600) suggests a shared range of principal curvatures where both distributions are active.
### Interpretation
The graph likely represents a comparative analysis of two curvature-related properties (e.g., material stress, geometric deformation) in a physical or structural system. The separation of peaks indicates distinct dominant curvature regimes for κ− and κ+, while the overlap suggests transitional or hybrid states. This could be critical in fields like materials science, biomechanics, or computational geometry, where curvature distributions influence mechanical behavior or stability. The normalized y-axis implies probabilistic or density-based interpretation, highlighting regions of highest likelihood for each curvature type.